
Hong Kong Market Barometer: CPO, PCB, and memory stocks rally in rotation! Are you on the right trai

China AMC Digital Gold ETF is now in its initial offering! A gold investment guide for volatile markets: volatility is the norm, and allocation perspective draws attention

The gold market in 2026 has left many investors scratching their heads—hitting a record high of $5,666 at the start of the year, then quickly pulling back in March, and since April, repeatedly oscillating around the $4,500 level.
Buying high risks getting trapped; staying on the sidelines risks missing out. Is gold still worth investing in? Is now the right time to position oneself?
In this article, we aim to cut through the fog of short-term volatility and re-examine gold’s role from an asset allocation standpoint.
I. Gold: The 'Ballast' in Your Portfolio
For the average investor, gold’s purpose has never been about generating quick, outsized gains, but rather about providing a safety cushion amid uncertainty.
Looking back, gold has gone through multiple bull and bear cycles. From the collapse of the Bretton Woods system in 1971—when gold was decoupled from the U.S. dollar and began trading at market-determined prices—to gold surpassing the $4,000 mark in 2025, it has remained a globally recognized hard currency for over half a century.
It relies on no nation’s creditworthiness and stands opposite no counterparty. This 'supra-sovereign' characteristic gives gold a unique role within investment portfolios—It is not an engine, but a stabilizer.。
From an asset allocation perspective, gold has historically exhibited low or even negative correlation with stocks and bonds. This means that under most macro stress scenarios—particularly those driven by inflation or geopolitical risks—gold often displays price behavior distinct from equities and fixed income. This isn’t the mystique of a 'safe-haven attribute,' but an objective principle rooted in gold’s intrinsic asset characteristics.
II. Long-Term Drivers: Three Core Rationales Remain Intact
Having understood gold’s role in a portfolio, we now need to address a more practical question:Has the fundamental rationale underpinning gold’s long-term value changed?
The answer is no. The following three dimensions form a solid foundation for gold’s long-term strategic allocation.
2.1 Sustained Central Bank Gold Purchases: The Most Direct 'Demand Floor'
We note that global central banks have been net buyers of gold for multiple consecutive years. In full-year 2025, central bank gold demand reached 863 tonnes, far exceeding historical annual averages. In Q1 2026, global central banks recorded net purchases of 244 tonnes, up 3% year-over-year, and above both the prior quarter and the five-year average.
The People’s Bank of China has increased its gold reserves for 18 consecutive months. As of end-April 2026, China’s gold reserves stood at 74.64 million troy ounces, reflecting cumulative purchases of over 300 tonnes—a record for the longest continuous buying streak. The pace of accumulation has accelerated month-over-month: 30,000 ounces in February, rising to 160,000 ounces in March, and further increasing to 260,000 ounces in April. This consistent counter-cyclical buying during periods of gold price volatility highlights a clear ‘buy-the-dip’ strategic resolve.
It is worth noting that some central banks have temporarily reduced holdings due to short-term fiscal or energy pressures (e.g., Turkey and Russia), but such moves represent tactical, emergency adjustments rather than strategic shifts. The overarching trend of net central bank gold purchases remains intact. According to a World Gold Council survey, over 95% of central banks plan to either continue adding to or maintain their gold reserves in 2026.
This wave of central bank gold buying serves as a ‘confidence anchor’ for gold’s long-term value—it provides demand support that is relatively insensitive to price fluctuations.
2.2 Deepening De-Dollarization: A Deeper ‘Structural Tailwind’
US government debt has surpassed $39 trillion, drawing market attention to fiscal sustainability. Meanwhile, the US dollar’s share in global foreign exchange reserves has fallen below 60%, hitting a multi-decade low.
Historically, gold prices have risen to varying degrees when the 'misery index' (unemployment rate + inflation rate) increases. Against the backdrop of persistent global stagflation concerns, gold’s role as an inflation hedge and a tool to offset currency depreciation has further enhanced its allocation value.
Amid frequent geopolitical risk events and rising global uncertainty, multiple institutions have recently raised their gold price targets again. Major firms such as Goldman Sachs, UBS Group, and JPMorgan generally project gold prices to reach the $5,400–$6,000 range by the end of 2026.
If central bank gold purchases are the 'surface,' de-dollarization is the 'substance'—it explains why central banks around the world are so uniformly increasing their gold holdings.
2.3 Global gold demand by value hits a record high: Investment demand is taking the lead
In Q1 2026, global gold demand by value surged 74% year-over-year to a record $193 billion. Although total physical demand rose only modestly by 2% to 1,231 tonnes, robust gold price gains amplified the value effect.
More notably, the composition of demand is shifting: investment demand is becoming the primary driver.
• Bar and coin demand jumped 42% year-over-year to 474 tonnes, marking the second-highest quarterly level on record, led by Asian markets;
• Global central banks added a net 244 tonnes of gold, up 3% year-over-year;
• Jewelry consumption volume declined 23% year-over-year, yet total spending rose 31% due to higher gold prices, indicating sustained consumer interest;
• Technology sector gold demand rose 1% year-over-year to 82 tonnes, primarily driven by the expansion of artificial intelligence infrastructure.
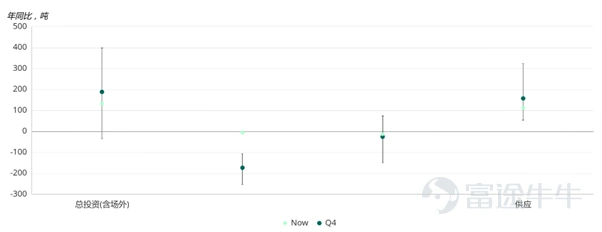
*Data as of March 31, 2026, sourced from Metals Focus and the World Gold Council.
The World Gold Council expects that geopolitical risks will continue to support investment demand and central bank gold purchases. Although jewelry demand remains under pressure, consumer spending is expected to stay resilient.
This dataset signals a shift: the share of investment-related demand in the overall gold demand structure has increased.
2.4 Gold ETF flows show positive signs
If the gold market had been 'bleeding' in previous months, April’s data provides a noteworthy turning signal.
According to the World Gold Council’s latest report, 'Gold ETF Flows: April 2026,' global gold ETF demand turned positive in April, with inflows recorded across all regions—European funds led the gains globally.
Driven by this trend, global gold ETF assets under management rose 1% month-over-month to USD 615 billion, and total holdings rebounded by 45 tonnes to 4,137 tonnes—the third-highest level on record, just slightly below the all-time high of 4,176 tonnes set in February this year.
By region:
• Europe: Recorded significant inflows of USD 3.7 billion in April, turning year-to-date fund flows from negative to positive. UK-based funds led this rally, as investors assess the impact of prolonged geopolitical conflicts on inflation and energy prices;
• North America: Reversed trend with $1 billion in inflows. This rebound was concentrated in the first half of the month, when gold prices were recovering from March lows;
• Asia: Recorded inflows for the eighth consecutive month, adding $1.8 billion in April; year-to-date inflows are on track to challenge last year's full-year record.
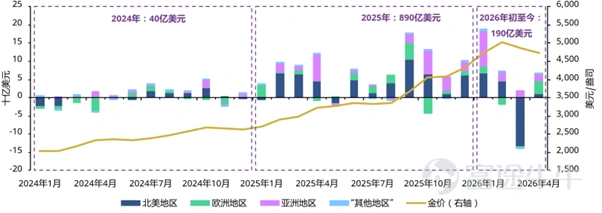
*As of April 30, 2026. Gold price data based on the monthly average LBMA afternoon gold price (in USD).
Source: Bloomberg, company filings, Intercontinental Exchange Benchmark Administration, World Gold Council
This dataset points to a straightforward conclusion: following significant outflows in March, long-term global capital is refocusing on gold’s allocation value. Although regional drivers differ—geopolitics in Europe, interest rates in North America, and volatility hedging in Asia—a consensus is emerging in capital flows.
The three key drivers—central bank gold buying, de-dollarization, and sustained overall gold demand—form a solid foundation for gold’s long-term value. This explains 'why gold deserves long-term allocation.' But investors face another more pressing question: Is now the right time to position?
III. Short-term volatility is normal; recent market dynamics warrant attention
Despite unchanged long-term fundamentals, the market has experienced a clear bout of short-term volatility.
The gold market in 2026 has gone through a complete cycle—from euphoria to quietude.
At the start of the year, gold prices rose steadily, briefly hitting an all-time high of $5,666, making it one of the most talked-about assets in investing at the time. Subsequently, as news confirmed Waller’s nomination as Fed Chair, some investors took profits, triggering a sharp pullback. In March, gold prices continued to decline amid surging oil prices. Since April, the market has entered a phase of choppy consolidation, currently trading in a narrow range around $4,500.
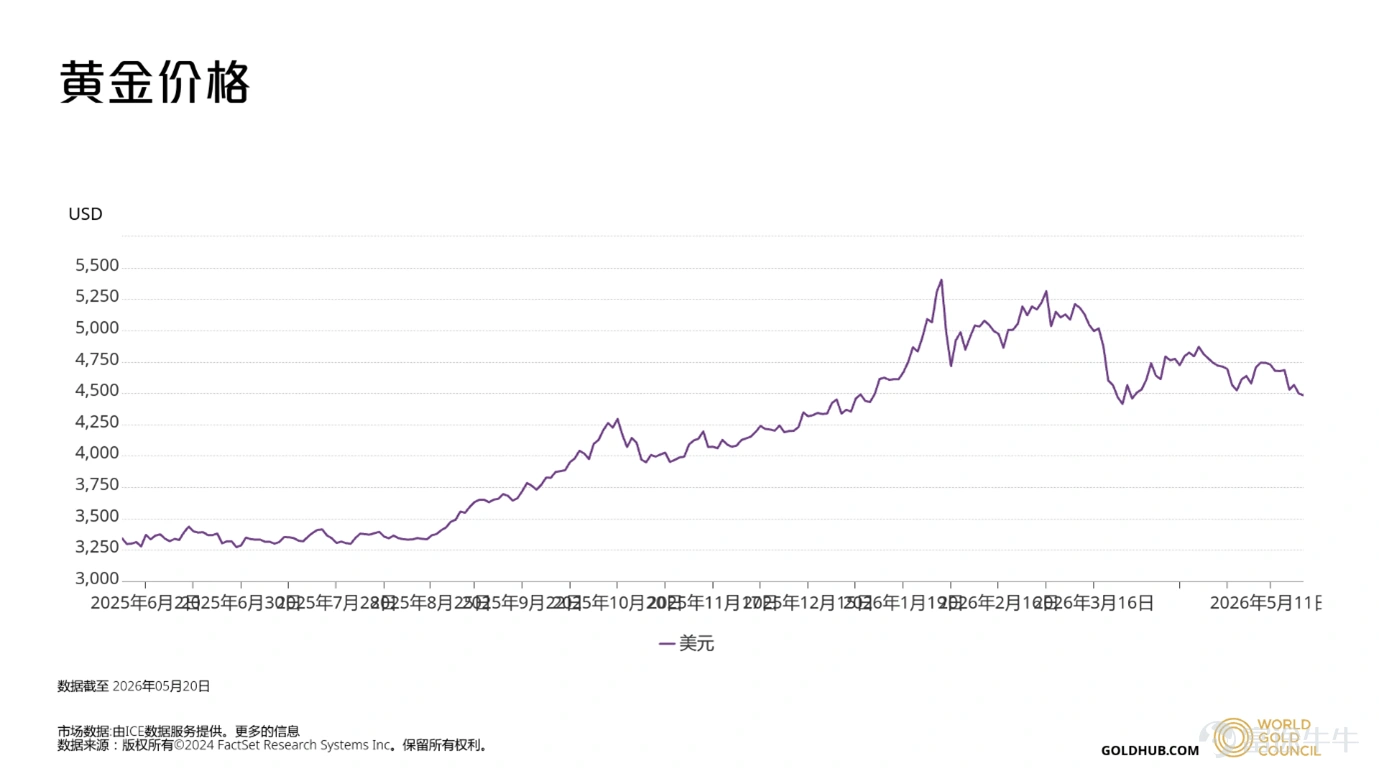
(Data as of May 20, 2026, World Gold Council)
From a market perspective, gold is currently caught between conflicting bullish and bearish forces. The Fed’s continued hawkish stance is capping any rebound in gold prices, while sustained central bank buying globally provides tangible support. Meanwhile, recurring geopolitical tensions in the Middle East intermittently stir short-term sentiment. Bulls and bears are locked in a tug-of-war around current levels, leaving both holders and onlookers facing heightened uncertainty.
Every major price move often quietly begins precisely when market sentiment is at its lowest and most investors are the most hesitant.
This current adjustment window presents an opportunity for investors to look beyond short-term volatility and reassess with a longer-term perspective—seize the window, scale in gradually, and stay proactive.
IV. A More Convenient Choice: China AMC Digital Gold ETF
Understanding the above dynamics, the next question for investors becomes: what vehicle should be used to allocate to gold?
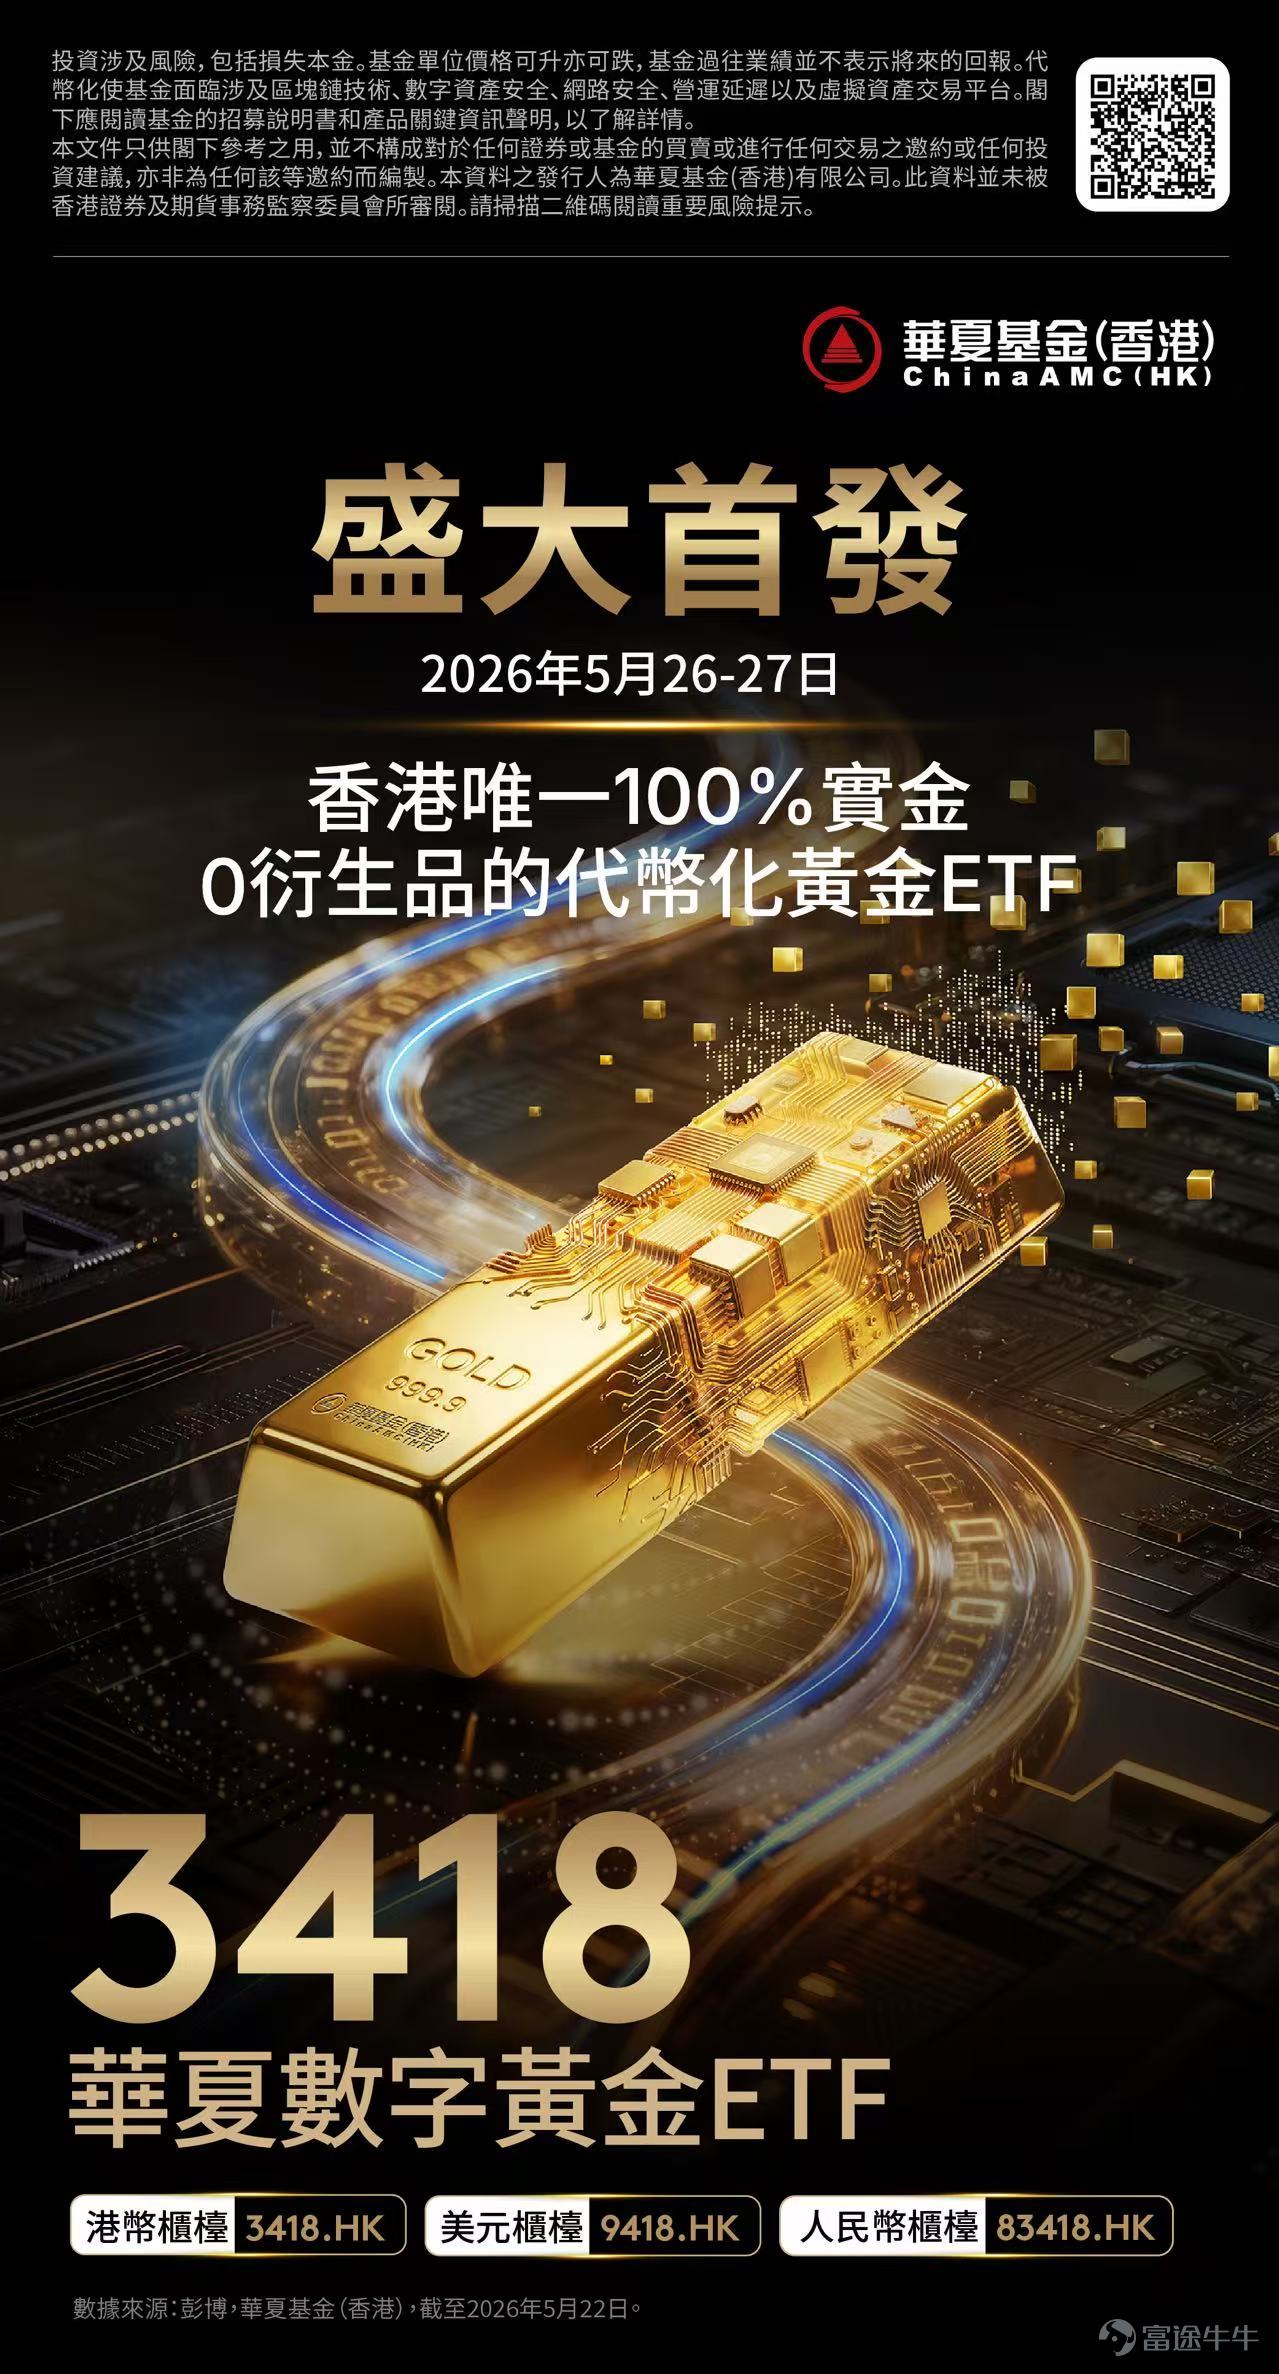
China AMC Digital Gold ETF (3418.HK / 83418.HK / 9418.HK) officially opens its initial subscription today.
• The world’s first and only tokenized physical gold ETF supporting subscriptions and redemptions in three currencies, powered by blockchain technology
• 100% backed by physical gold, zero derivatives: each fund unit is fully supported by actual physical gold
• Gold stored in Hong Kong vaults with full insurance coverage: custodied by Standard Chartered Bank, held in professional vaults, and fully insured throughout
• *Lowest entry threshold in Hong Kong: Making gold allocation within reach
$SSE Composite Index (000001.SH)$$CSI 300 Index (000300.SH)$$NVIDIA (NVDA.US)$$Amazon (AMZN.US)$$Alphabet-C (GOOG.US)$$Meta Platforms (META.US)$$Tesla (TSLA.US)$$HSTECH (LIST91332.HK)$$Hang Seng Index (800000.HK)$$SSE 50 Index (000016.SH)$$CSI 300 Index (000300.SH)$$CSI 1000 Index (000852.SH)$$SSE Science and Technology Innovation Board 50 Index (000688.SH)$$ChinaAMC CSI 300 Index ETF (03188.HK)$$SSE Composite Index (000001.SH)$$XIAOMI-W (01810.HK)$$JD.com (JD.US)$$TENCENT (00700.HK)$$Shenzhen Component Index (399001.SZ)$$Kweichow Moutai (600519.SH)$$Contemporary Amperex Technology (300750.SZ)$$PING AN (02318.HK)$$Alibaba (BABA.US)$$ICBC (01398.HK)$$CHINA MOBILE (00941.HK)$
Sources:
1. Global Gold Demand Trends Report 2025, World Gold Council, January 29, 2026, https://china.gold.org/news/press-releases/2026/01/29/19475
2. People’s Bank of China has increased its gold reserves for 18 consecutive months, Securities Times, May 7, 2026, https://www.stcn.com/article/detail/3898936.html
3. Report shows: Global central banks added 244 tonnes of gold in Q1, up 3% year-over-year, People.cn Finance, April 30, 2026
4. U.S. national debt exceeds $39 trillion, FRED Economic Data, https://fred.stlouisfed.org
5. Summary of major institutions' gold price forecasts: Goldman Sachs, May 15, 2026, Central Bank Gold Purchase Model Revision and Gold Outlook; JPMorgan, May 17, 2026, Precious Metals Market Outlook – Gold Pauses Rather Than Reverses, Silver Thesis Unravels; UBS Group, May 12, 2026, Gold and Precious Metals Outlook
6. Gold ETF Trends: April 2026, May 7, 2026, https://china.gold.org/goldhub/research/gold-etfs-holdings-and-flows/2026/04
7. Global Gold Demand Trends: Q1 2026, April 29, 2026, https://china.gold.org/page/19609
8. LBMA Gold Price data, administered by Intercontinental Exchange Benchmark Administration
Website: LBMA Precious Metal Prices | LBMA
*Based on the LBMA Gold Price AM benchmark of $4,537.70 as of May 21, 2026, and given that each fund unit is valued at 1/1,000th of the LBMA Gold Price AM on that day, the estimated net asset value per fund unit is approximately $4.54. According to Bloomberg data, the USD/HKD exchange rate was approximately 7.83 as of 5:30 PM on May 21, 2026. Applying this exchange rate, the indicative price per fund unit is approximately HK$35.5, with an indicative board lot price of HK$355.
Risk Warning: Gold prices are influenced by multiple factors including international geopolitical developments, monetary policy, and market sentiment. Past performance does not indicate future results. The content of this article is for reference only and does not constitute investment advice. Investors should make prudent investment decisions based on their own risk tolerance.
Investing involves risks, including the potential loss of principal. The price of fund units may rise or fall, and past performance of the fund does not indicate future returns. Tokenization exposes the fund to risks related to blockchain technology, digital asset security, cybersecurity, operational delays, and virtual asset trading platforms. You should read the fund's offering document and Key Information Document (KID) for further details. Investors should not make investment decisions based solely on this marketing material.
This document is provided for your reference only and does not constitute an offer or solicitation to buy or sell any securities or funds, nor does it provide investment advice, nor was it prepared in connection with any such offer. This material is issued by China AMC (Hong Kong) Limited. This document has not been reviewed by the Securities and Futures Commission of Hong Kong.
Risk Disclaimer: The above content only represents the author's view. It does not represent any position or investment advice of Futu. Futu makes no representation or warranty.Read more

Comments
to post a comment
3
3