
Hong Kong Market Barometer: CPO, PCB, and memory stocks rally in rotation! Are you on the right trai
Hong Kong Exchange is currently trading below its 10-day and 30-day moving averages but above its 60-day moving average, indicating short-term pressure with medium-term support.
On May 22, Hong Kong Exchange (00388) closed at HK$410.6, up 0.79%, with a trading volume of approximately HK$729 million. In the short term, the stock is exhibiting a narrow-range consolidation pattern. The share price lies between multiple moving averages—currently below the 10-day MA at HK$416.4 and the 30-day MA at HK$414.86, yet still above the 60-day MA at HK$409.09—forming a technical structure characterized by 'short-term pressure with medium-term support.' Regarding Bollinger Bands, the middle band is around HK$414.86, the upper band near HK$429, and the lower band near HK$396. The current price of HK$410.6 is slightly below the middle band, placing it in the lower-mid section of the channel, suggesting the stock has not yet re-entered the strong zone but hasn’t fallen into a weak area either. The Relative Strength Index (RSI) stands at 47, within a neutral-to-slightly-weak range—not overbought nor oversold—with neutral momentum.
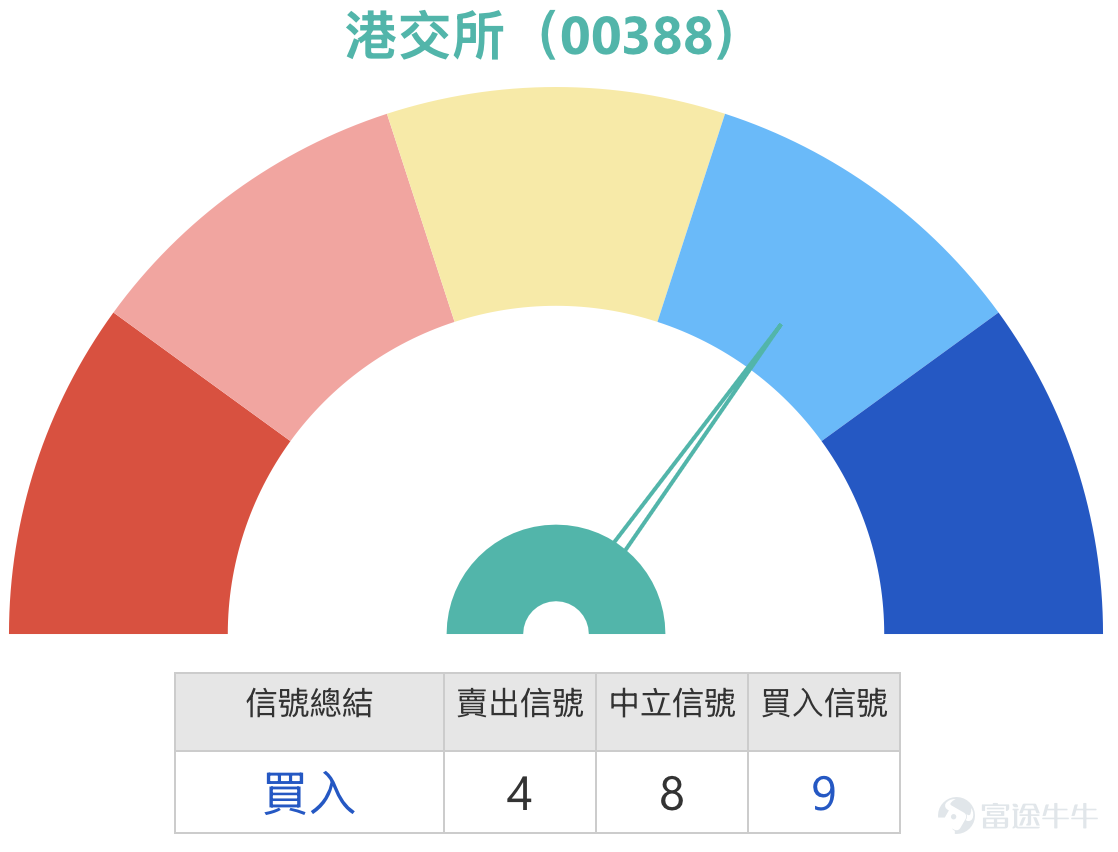
In terms of technical signals, the composite technical signal indicates a 'Buy' with a strength rating of 9. Among several oscillators, the Stochastic Oscillator issues a buy signal, while the Williams %R, CCI, and ADX indicators all show neutral signals. Both the Momentum Oscillator and Rate of Change indicators issue sell signals, whereas the Bulls vs. Bears Power indicator shows a buy signal. The MACD gives a sell signal, and the Bollinger Bands remain neutral. Notably, on May 21, the market exhibited a 'death cross' technical pattern, where the 10-day moving average crossed below the 20-day moving average—a bearish signal from a technical analysis perspective. However, technical analysis should only serve as an auxiliary tool; trading decisions should not rely solely on a single pattern.
The 5-day price amplitude is approximately 2.9%, reflecting relatively low volatility and suggesting short-term investors are adopting a wait-and-see stance. The 5-day probability of upward movement is about 46%, indicating unclear short-term direction.
Market News and Stock Price Correlation
Major brokerages generally maintain positive ratings, with target prices significantly above the current level. On May 7, Morgan Stanley raised its target price for Hong Kong Exchange from HK$510 to HK$515, maintaining an 'Overweight' rating. Morgan Stanley revised its listing fee forecasts upward to reflect a robust IPO pipeline and strong EFD business performance, also increasing its net investment income forecasts for 2026–27 by 4%–5%. It slightly reduced total expense forecasts by 0.4% due to cost discipline. JPMorgan raised its EPS forecasts for fiscal years 2026–2028 by 2%, keeping an 'Overweight' rating. On May 20, Yangtze Securities issued a 'Buy' rating, noting that Hong Kong Exchange currently trades at a PE ratio of 28.48x, sitting at the 11th percentile of its historical range since 2016, offering attractive valuation for portfolio allocation. It expects continued policy support for mutual market connectivity to further enhance liquidity in the Hong Kong equity market. According to data, 26 investment banks have issued 'Buy' ratings over the past 90 days, with an average target price of HK$524.22.

Support and Resistance Level Analysis
On the support side, HK$405 represents the first key defensive level. This level lies below both the 10-day MA (HK$416.4) and the 30-day MA (HK$414.86), and is close to the May 21 closing low of HK$407.4—a zone where buying interest typically emerges during short-term pullbacks. HK$396 serves as the second line of support, aligning with the lower Bollinger Band and corresponding to the 'Support 2' level in user-defined technical indicators. Should HK$405 be breached, HK$396 would become the next critical observation point, representing a deeper short-to-medium-term defensive level.
On the upside resistance front, HK$420 is currently the most immediate overhead pressure within the technical framework. This level corresponds to the first resistance level in common technical indicators and is also near the middle band of the Bollinger Bands. The resistance zone formed by the 10-day moving average at HK$416.4 and the 30-day moving average at HK$414.86 has already created noticeable pressure; a breakout would require clear confirmation from trading volume. HK$429 represents the second resistance level and aligns with the upper Bollinger Band, serving as a more aggressive rebound target. The current price of HK$412.4 still has approximately HK$7.6 of room before reaching this resistance, but any upward breakout will depend on whether trading volume can follow through.
Review of Warrant Products
The Hong Kong Exchange bear warrants mentioned on May 19 recorded varying degrees of gains over the two trading days ending May 21. During this period, the underlying stock of JPMorgan’s bear warrant (68170) declined by 0.63%, while the warrant itself rose by 5%, effectively capturing volatility despite only a modest drop in the underlying. UBS Group’s bear warrant (67346) on the Hong Kong Exchange gained 7% over the same period, delivering even stronger performance. $UB#HKEX RP2807G.P (67346.HK)$$JP#HKEX RP2812A.P (68170.HK)$
Among this group of products, the UBS Group bear warrant stood out with a 7% gain. These figures illustrate that when Hong Kong Exchange shares trade weakly below both the 10-day and 30-day moving averages, bear warrants structured near the overhead resistance zone can still register price appreciation as the underlying faces pressure. Although the underlying stock declined by only 0.63% during this period, both bear warrants generated positive returns—primarily because their terms were set close to the resistance area, allowing them to respond sensitively even to minor downward moves in the underlying.

Warrant and Callable Bull/Bear Contract (CBBC) Deployment Recommendations
For call warrants, Société Générale’s call warrant (27838) has a strike price of HK$474.08 and offers 11.9x leverage. Its combination of leverage and implied volatility is relatively attractive, making it suitable for investors expecting the stock to break above HK$420 and continue rallying toward the HK$429 range. JPMorgan’s call warrant (27464) features a strike price of HK$473.88 and 11.5x leverage—the highest leverage among comparable products—and comes with relatively low implied volatility, ideal for more aggressive positioning if one anticipates a sustained rebound following a breakout.
For put warrants, JPMorgan’s put warrant (27321) carries a strike price of HK$355.55 and offers 11x leverage, presenting an appealing balance of leverage and implied volatility for investors expecting the stock to stall near HK$420 and retreat. UBS Group’s put warrant (27573) has a similar strike price of HK$355.35 and slightly higher leverage at 11.4x, offering an alternative issuer choice with comparable terms. Both warrants are deeply out-of-the-money, as their strike prices sit well below the second support level at HK$396.

Regarding bull contracts, UBS Group’s bull warrant (69858) has a call price (knock-in level) of HK$374 and provides 9.8x leverage, offering relatively high effective leverage—suited for investors who expect the stock to hold firm within the support zone between HK$405 and HK$396 and then rebound. JPMorgan’s bull warrant (58414) features a lower call price of HK$370 and 9.4x leverage, boasting the lowest premium among comparable products and higher effective leverage, thereby providing a more comfortable buffer against early recall.
For bear contracts, JPMorgan’s bear warrant (57489) has a call price of HK$448 and offers 11.6x leverage—the highest effective leverage in its peer group—with a relatively low premium, making it suitable for investors anticipating that the stock will face selling pressure within the resistance zone between HK$420 and HK$429 and subsequently pull back. UBS Group’s bear warrant (55624) features a call price of HK$440 and significantly higher leverage at 15.9x, coupled with the lowest premium among peers and elevated effective leverage, giving investors a choice between different leverage levels and recall thresholds. $UB#HKEX RP2812C.P (55624.HK)$$JP-HKEX@EC2609C.C (27464.HK)$$SG-HKEX@EC2609D.C (27838.HK)$$UB-HKEX@EP2609A.P (27573.HK)$

Overall, Hong Kong Exchange currently exhibits a technical structure characterized by 'strong fundamentals but short-term pressure.' The share price trades below both the 10-day and 30-day moving averages, and the RSI at around 47 indicates neutral momentum, while a death cross formation adds further technical headwinds. However, Q1 earnings hit a record high, leading major banks to raise their target prices, and the stock’s valuation remains at historically low levels—providing solid fundamental support over the medium to long term. Persistent outflows from southbound capital and institutional investors constitute the primary source of near-term pressure, explaining why strong earnings have not translated into upward price momentum. In terms of short-term strategy, range-bound trading is the prevailing approach: if the HK$405 support holds, watch for a potential rebound toward the HK$420 resistance; a confirmed breakout and sustained close above HK$420 would open the path toward testing HK$429; conversely, a breakdown below HK$405 would shift focus to the next support level at HK$396.
Friendly reminder: This article does not constitute any investment advice. It is for reference only and does not constitute any form of investment recommendation. The market data, opinions, and analysis contained herein may change at any time without prior notice. We assume no responsibility for any loss or damage caused by reliance on the information in this article. Technical analysis only shows whether certain technical conditions are met; a comprehensive evaluation of asset performance should be conducted using additional data. Trading decisions should not be made solely based on this article. Please note that past performance is not indicative of future results. Follow Jenny's Warrants HKEX column for more professional insights.
Risk Disclaimer: The above content only represents the author's view. It does not represent any position or investment advice of Futu. Futu makes no representation or warranty.Read more

Comments
to post a comment
1