Baidu is in a technical downtrend; its rebound failed to stabilize around the midline, making RMB 130.9 the key level for bulls and bears.
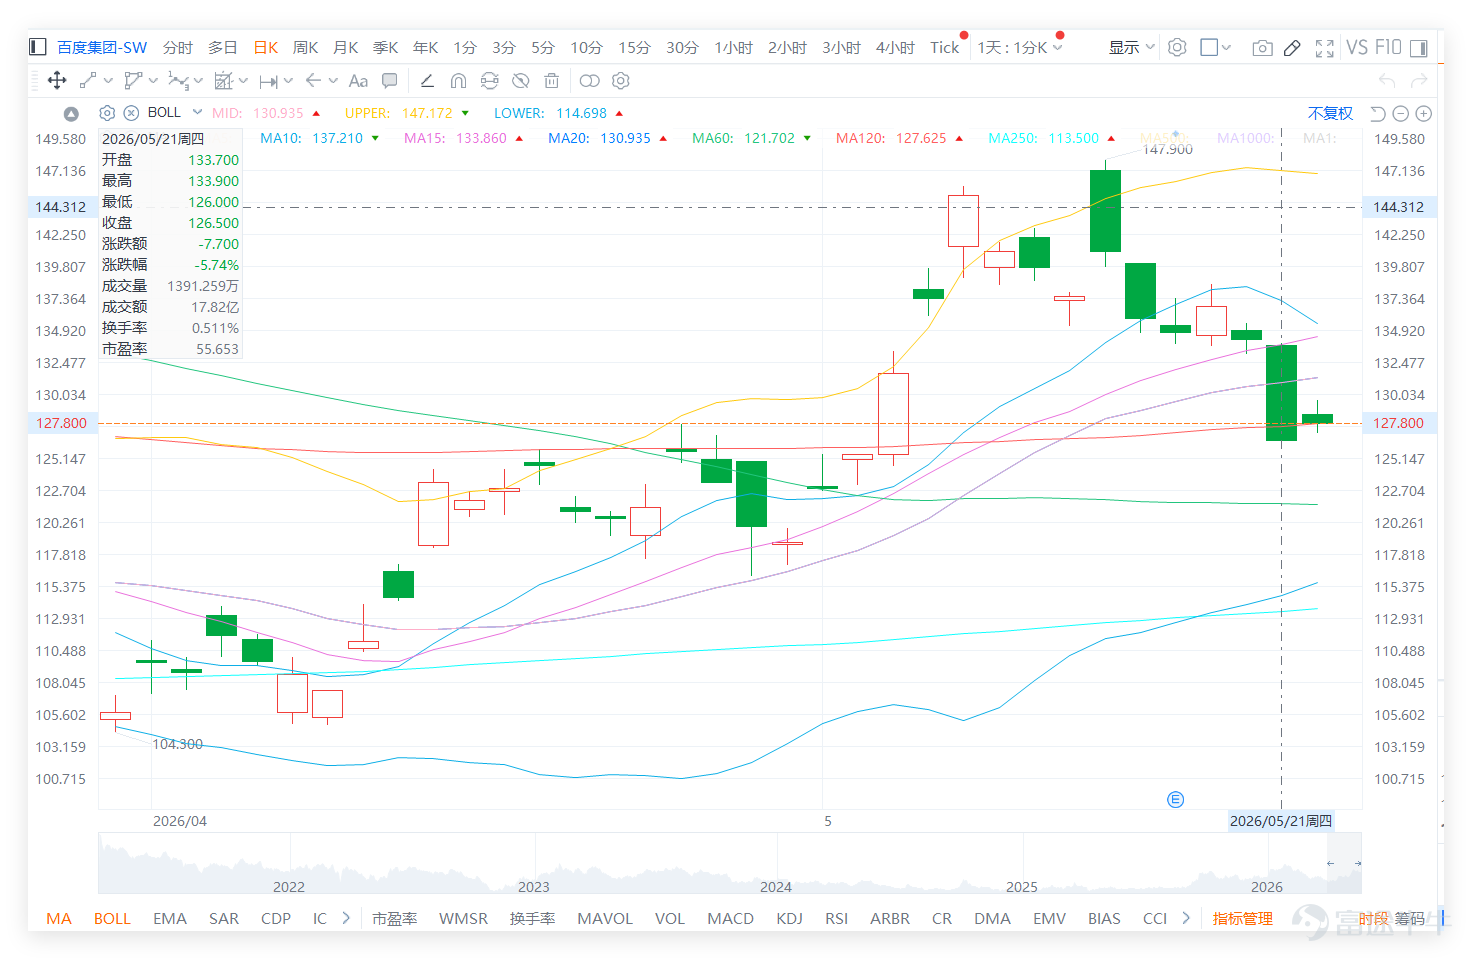
$BIDU-SW (09888.HK)$ It closed at HK$126.500 the previous day (21st), down HK$7.700, a single-day decline of 5.74%. The stock hit an intraday high of HK$133.900 and a low of HK$126.000, closing at HK$126.500—clearly near the session's low—indicating that the intraday rebound failed to hold and selling pressure at higher levels remains significant. For short-term retail investors, the key signal from the previous day was not the 5.74% drop per se, but rather the retreat from HK$133.900 to close at HK$126.500, reflecting insufficient buying momentum and an inability to escape the prevailing weak trend even after a rebound.

Baidu’s technical signal is 'neutral' (constrained by the midline). Compared with large internet peers, $TENCENT (00700.HK)$ closed at HK$439.0 (RSI around 32, technical buy), $BABA-W (09988.HK)$ closed at HK$126.0 (RSI around 44, technical buy), $MEITUAN-W (03690.HK)$ closed at HK$82.1 (RSI around 48, technical buy). This indicates the broader tech sector is in a 'low-level recovery' phase. Although Baidu has not yet regained strength, it remains aligned with the sector’s rhythm, and short-term focus should be on defending the 30-day moving average.

From a technical structure perspective, Baidu closed yesterday at HK$126.500, slightly above the 30-day moving average of HK$126.120—a level that can still be considered to offer some support. The fact that the stock held near the 30-day MA at the close suggests there is temporary buying interest in the HK$126.000–126.120 range. However, the current price remains below both the 20-day MA at HK$130.935 and the 10-day MA at HK$137.210, indicating the recent rebound has failed to re-establish stability above key resistance levels. In other words, although Baidu rebounded from lows yesterday, it has not yet reclaimed the short-term midline, and the overall pattern remains one of post-rebound pressure rather than a confirmed strengthening trend.
Regarding Bollinger Bands, the middle band is at HK$130.935, the upper band at HK$147.172, and the lower band at HK$114.698. Baidu’s closing price of HK$126.500 yesterday remains below the Bollinger Band middle band, placing the stock in the weaker zone beneath the midline. For short-term conditions to improve, the most direct requirement would be a sustained break above HK$130.935—an important technical level that coincides with both the 20-day moving average and the Bollinger Band middle band. Without reclaiming this level, even yesterday’s notable gain should only be viewed as a weak rebound; only if the price breaks and holds above HK$130.935 can we consider targets like HK$133.900 and HK$137.210.
The Relative Strength Index (RSI) stands at approximately 31.633, still in a relatively weak range, reflecting that momentum has not fully recovered. This aligns with yesterday’s price action, where the stock pulled back from intraday highs. If the stock were truly turning stronger, we would expect to see the RSI rising alongside a closing price closer to the day’s high. However, the opposite occurred: Baidu rallied to HK$133.900 during the session but closed at HK$126.500, indicating significant selling pressure during the rebound. Under such conditions, it is unwise to chase the stock based solely on the day’s gains; confirmation from support and resistance levels is still needed.
From the key comments, market sentiment toward Baidu was highly divided yesterday. Bullish views centered on sentiments like 'buy after filling the gap,' 'successfully caught the bottom,' 'don’t let it slip away,' and 'waiting for a breakout'—all reflecting a mindset of low-level rebound. Some investors also expressed disagreement from a fundamentals or thematic perspective, arguing the stock price does not reflect Baidu’s true strength. Such comments suggest some retail investors believe Baidu has already declined significantly and that yesterday’s rebound may mark the start of a recovery. However, this bullish sentiment still requires technical confirmation, as the stock failed to hold its intraday high and did not stabilize above HK$130.935.
Bearish comments focused on several themes. First, some believe the rebound could precede a deeper correction cycle. Second, doubts were raised about share buybacks, insider selling, advertising business performance, AI investments, and valuation. Third, some directly forecast much lower prices—such as HK$110, HK$100, or even HK$70. While these targets shouldn’t all be taken as precise technical levels, they do reflect persistent lack of confidence in Baidu. Yesterday’s pullback from highs reinforced the perception among some investors that 'any rally gets sold into.' Technically, if the HK$126.000–126.120 zone fails to hold, the likelihood of a failed rebound increases, shifting market focus back to support near HK$123 and the Bollinger Band lower band at HK$114.698.
Comments expressing uncertainty or emotional reactions were also very evident. Many investors asked, 'Can I buy now?', 'Is it almost there?', 'Why does it keep falling?', 'I’m trapped again,' or 'Give us some hope.' Others noted that every small rally quickly reverses. These sentiments precisely highlight Baidu’s core issue right now: it’s not that rebounds are absent, but that they lack follow-through. What retail investors fear most isn’t the absence of gains, but gains that vanish quickly—leaving even those who bought at lows feeling uneasy. Yesterday’s drop from HK$133.900 to HK$126.500 intensified exactly this psychological pressure.
Common questions can be grouped into three.
First, should one buy Baidu now? From a technical standpoint, the HK$126.000–126.120 range serves as a short-term defensive line. If it holds, there remains room for recovery; however, until the price breaks above HK$130.935, the risk-reward ratio remains neutral-to-low, and premature chasing is not advisable.
Second, has Baidu already bottomed? A bottom cannot yet be confirmed, as the price remains below both the Bollinger Band middle band and the 20-day moving average, and the pullback from intraday highs was pronounced.
Third, what happens if the price breaks below HK$126? A breach of HK$126 would increase the likelihood of a failed rebound, with next support around HK$123. If weakness continues, attention would shift to the Bollinger Band lower band at HK$114.698.
In terms of short-term strategy, the most critical level for Baidu right now is to hold support between RMB 126.000 and RMB 126.120. This zone includes yesterday’s low and the 30-day moving average, serving as the first line of defense for sustaining any short-term rebound. If the stock price stabilizes here and breaks back above RMB 130.935, the technical structure may shift from weak recovery toward a more substantive rebound. The next resistance levels to watch would be RMB 133.900 and RMB 137.210. RMB 133.900 marks yesterday’s high—if this level is reclaimed, it suggests that selling pressure near recent highs is starting to ease. RMB 137.210 corresponds to the 10-day moving average; reclaiming this level would significantly improve the short-term technical setup.
Conversely, if the share price falls below RMB 126.000, yesterday’s rebound could be deemed a failure. Especially since the stock already pulled back from its intraday high yesterday, failing to hold even RMB 126 would further erode market confidence in the rebound. In such a scenario, initial support would be seen near RMB 123, followed by the lower Bollinger Band at RMB 114.698. This doesn’t necessarily mean the price will drop all the way to RMB 114.698, but if short-term support levels continue to give way, the market will naturally seek the next clear technical support zone.
Overall, Baidu did rebound yesterday, but it wasn’t a strong one. Although the 5.74% gain appears impressive, the close near the day’s low, inability to stabilize above RMB 130.935, and still-weak Relative Strength Index (RSI) all indicate the technical condition hasn’t fully recovered. Among comments, bulls hope for a gap-fill followed by a rebound, are buying the dip, or waiting for a breakout; bears worry about a significant pullback, valuation de-rating, and even lower prices; while those on the sidelines are most concerned about whether it’s safe to enter, why the stock is falling again, and whether they’re getting trapped. Technically, the answer is clear: RMB 126.000–126.120 is the key support zone, and RMB 130.935 is the make-or-break level. Until Baidu reclaims RMB 130.935, it remains in a weak recovery phase; if it drops below RMB 126, the risk of rebound failure rises markedly.
Latest Update (Morning of May 22):
Baidu is currently trading at RMB 128, up 1.19% on the day, having moved back above the 30-day moving average (around RMB 126.12). It has so far held the RMB 126 support line but continues to trade below the pivotal level of RMB 130.94. In the short term, we need to monitor whether it can reclaim the RMB 130 psychological mark.
Reply to some investors' views:
@飛龍在天27: Technically, the two most critical levels right now are RMB 126.000–126.120 as support and RMB 130.935 as the pivot point. Until the stock breaks above this pivot, it remains in a weak recovery mode.
@28254698: Going all-in carries high risk, as today’s price clearly pulled back from its high and failed to stabilize above RMB 130.935. To justify a straight-line long position, the stock would need to first break above both RMB 130.935 and RMB 133.900.
@谨小慎微的菲利普斯: The precondition for not exiting positions is that RMB 126 must hold. If the price breaks below RMB 126, the risk of yesterday’s rebound failing increases significantly.
Based on the above analysis, the strategies for deployment can be divided into the following main approaches:
Key focus for positioning: In the short term, watch whether support at RMB 126.000–126.120 holds. Only if it holds firm and the price breaks above RMB 130.935 can the outlook meaningfully improve. Next resistance levels to monitor are RMB 133.900 and RMB 137.210. If the price breaks below RMB 126.000, the likelihood of rebound failure rises, with subsequent support levels around RMB 123 and RMB 114.698.
Strategy 1 | Bet on rebound recovery after holding RMB 126
$UBBAIDU@EC2609A.C (28166.HK)$ | Strike price RMB 140 | Effective leverage 5.1x | Strike price near upper rebound resistance zone—suitable for betting on recovery after holding RMB 126, but better risk-reward only emerges once the stock stabilizes above key levels.
$MSBAIDU@EC2609A.C (27488.HK)$ | Strike price HK$139.90 | Effective leverage 5.1x | Reacts directly to a breakout above HK$130.935; suitable for capturing a short-term rebound from lower levels toward the HK$133.900 area
$MBBAIDU@EC2609A.C (19700.HK)$ | Strike price HK$109.888 | Effective leverage 3.9x | Strike price below current market price, offering higher defensive positioning; suitable for investors bullish on the stock holding above HK$126 but wishing to avoid excessive volatility
Strategy 2 | After breaking above HK$130.935, target a move toward HK$133.900–HK$137.210
$UBBAIDU@EC2610A.C (27686.HK)$ | Strike price HK$151.21 | Effective leverage 4.9x | Higher strike price offers noticeably more elasticity than Strategy 1; suitable for chasing an extended rebound after the stock breaks above HK$130.935
$MSBAIDU@EC2610A.C (28328.HK)$ | Strike price HK$153.99 | Effective leverage 4.9x | Best used when trading volume improves post-breakout; product is farther from current price and focuses more on sustained rebound momentum
$HUBAIDU@EC2611A.C (26819.HK)$ | Strike price HK$145 | Effective leverage 4.6x | Strike price positioned between near-term resistance and higher elasticity; suitable after the stock breaks through the midline, aiming to gradually challenge HK$133.900 and HK$137.210
Strategy 3 | Turn bearish if price falls below HK$126
$UBBAIDU@EP2607A.P (20739.HK)$ | Strike price HK$113.78 | Effective leverage 6.9x | Strike price close to the support zone at HK$114.698; suitable for betting on failed rebounds and a retest of lower support after the stock breaks below HK$126
$CIBAIDU@EP2607A.P (20548.HK)$ | Strike price HK$113.88 | Effective leverage 6.5x | Also centered around the HK$115 support line; suitable for bearish positioning with an initial target range of HK$123 to HK$114.698
$UBBAIDU@EP2611A.P (28720.HK)$ | Strike price HK$109.88 | Effective leverage 3.6x | Lower strike price with moderate leverage; suitable for use when weakness persists after a break below HK$123, with a more defensive bearish approach
For more market analysis, stay tuned to Jenny's daily updates on 'Hong Kong Stock Warrants'!
Friendly reminder: This article does not constitute any investment advice.
This article is for reference only and does not constitute any investment advice. Market data, opinions, and analysis contained herein may change at any time without prior notice. We are not responsible for any loss or damage caused by reliance on the information in this article. Technical analysis only shows whether certain technical conditions are met; asset performance should be comprehensively evaluated using other sources of information, and trading decisions should not be made solely based on this article. Please note that past performance is not indicative of future results.
#HongKongStocks #Baidu#Real-TimeAnalysis #WarrantSelection #WarrantGuide #DerivativesHedging #HKExWarrantsJenny #Blue-ChipStocks #TechnicalAnalysis
Risk Disclaimer: The above content only represents the author's view. It does not represent any position or investment advice of Futu. Futu makes no representation or warranty.Read more
Comments
to post a comment