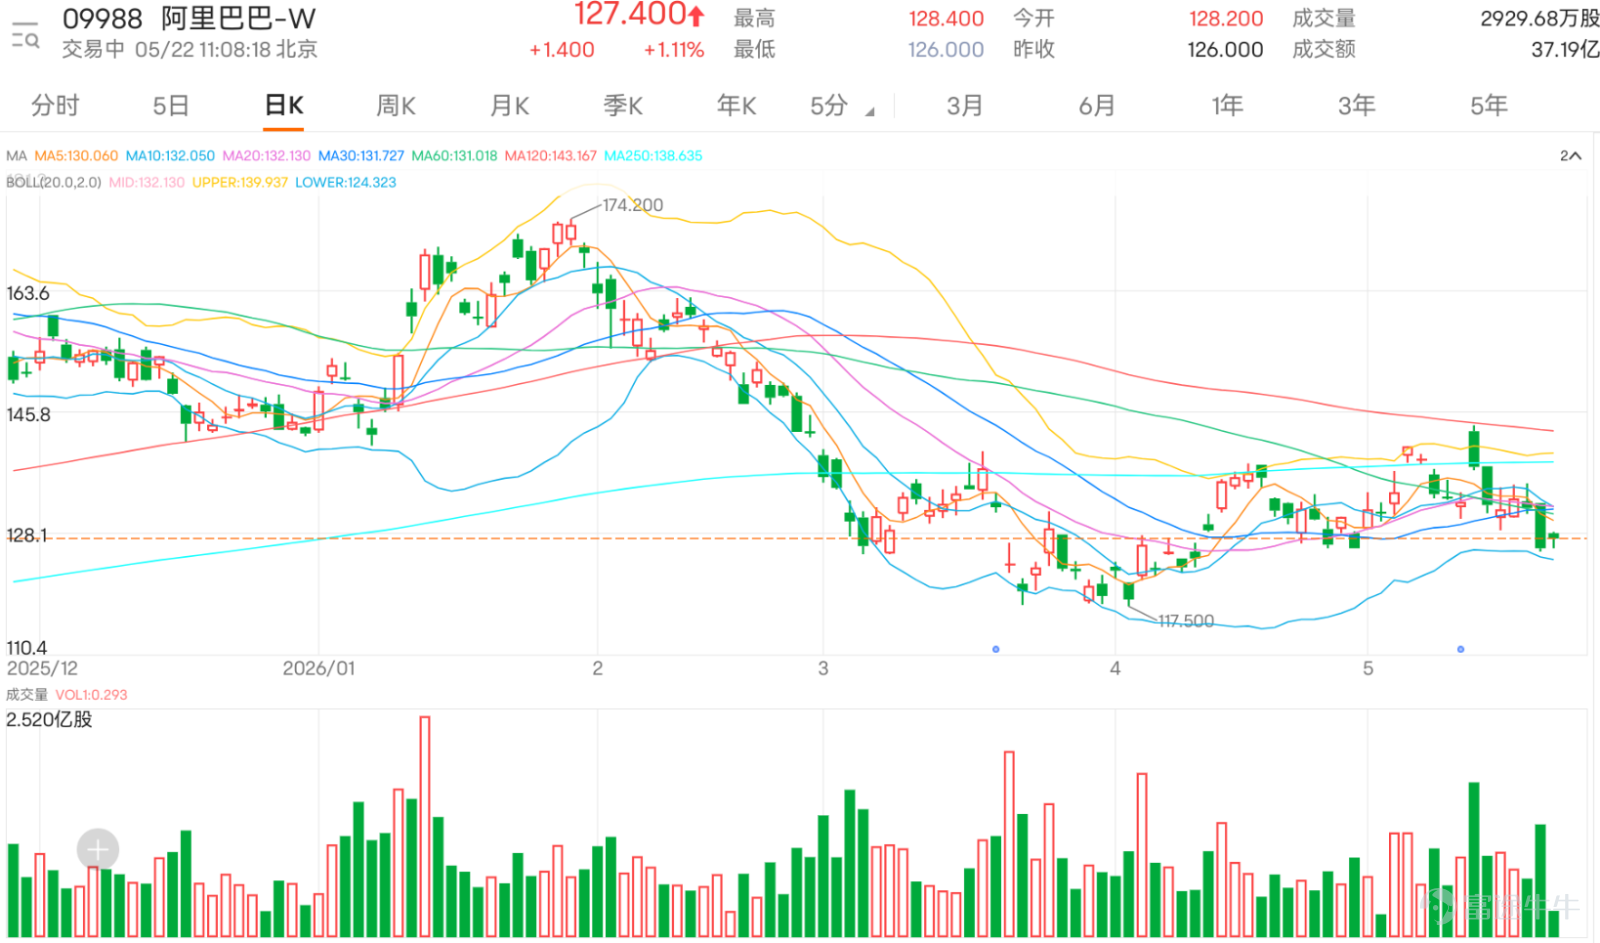
Alibaba is falling close to the lower Bollinger Band, with HK$125.50 acting as a short-term support level
$BABA-W (09988.HK)$ Currently trading at HK$127.300, up 1.03%. Technically, Alibaba’s current price is below the 10-day moving average (MA) at HK$133.210, the 20-day MA at HK$132.280, and the 30-day MA at HK$131.577. All three key short-term moving averages are above the share price, indicating a renewed weakening in the short-term trend. Notably, both the 20-day MA and the middle Bollinger Band are near HK$132.280, making this level a critical short-term pivot for any potential recovery. Unless the stock reclaims HK$132.280, any bounce from lower levels should be viewed as a weak technical rebound rather than a sign of renewed strength.
Regarding the Bollinger Bands, the middle band is at HK$132.280, the upper band at HK$139.828, and the lower band at HK$124.732. Alibaba’s current price is very close to the lower Bollinger Band, suggesting it is technically oversold and theoretically eligible for a technical rebound. However, proximity to the lower band does not guarantee a bottom—especially since yesterday’s decline was accompanied by higher trading volume, confirming selling pressure with market participation. If the stock holds above HK$125.500 and HK$124.732, a technical rebound remains possible; but if it breaks below HK$124.732, the downtrend may continue, with the next support level to watch at HK$117.500.
The Relative Strength Index (RSI) is around 30.707, indicating a weak condition and reflecting a clear loss of short-term momentum. This level presents a mixed picture: on one hand, the stock has fallen into an oversold zone, reducing the risk-reward appeal of further shorting; on the other hand, momentum has yet to recover, and the price has not yet moved back above key moving averages. At this stage, we cannot confirm that a rebound has begun. A more prudent approach is to treat the HK$125.500–HK$124.732 range as a short-term defensive zone and HK$132.280 as the key level for any meaningful recovery. Holding above the lower zone merely prevents further weakness, while reclaiming HK$132.280 would signal a potential improvement in trend.
From key comments, market sentiment toward Alibaba was generally weak yesterday, yet there was notable divergence. Bulls mainly focused on buying at lows, expecting a short-term rebound, questioning whether the stock could reclaim HK$130, and arguing that the current price already offers short-term value. Some investors suggested that after falling to these levels, it’s worth taking a short-term position, while others anticipated a bounce back to HK$130. Such comments reflect that some retail traders believe the price near HK$126 is close to the lower Bollinger Band, leaving room for a short-term technical rebound. From a technical perspective, this view isn’t entirely baseless—since HK$126 is near the lower band at HK$124.732, a technical rebound from oversold levels is indeed possible.
However, bullish conditions have not yet been confirmed. If the stock fails to break back above HK$132.280, any market rebound will likely be seen as a weak technical pullback. For long positions, the immediate focus should not be on targets above HK$130, but first on whether HK$125.500 and HK$124.732 can hold as support, followed by whether HK$132.280 can be reclaimed.
Bearish comments focus on several key points: first, concerns that capital is being diverted to new IPOs or other sectors, and that selling pressure on Hong Kong tech stocks has not yet run its course; second, worries that external factors or a broader tech sector correction could drag down Alibaba; third, some mention price levels of HK$110, HK$115, or even more extreme lows. These comments clearly reflect weak market confidence in Alibaba. Technically, the bears’ strongest argument is that the share price has broken below the 10-day, 20-day, and 30-day moving averages, with the decline accompanied by rising trading volume. As long as the price fails to reclaim HK$132.280, bears will maintain short-term dominance.
Comments expressing uncertainty or posing questions reveal confusion and panic among current holders. Many investors are asking, 'What’s happening?', 'Why is it falling?', 'Is this a crash?', 'When should I take profit on my puts?', and 'Is HK$115 just a dream?'. Such remarks indicate the market isn’t simply bearish—it has lost short-term direction. Naturally, when the price approaches the lower Bollinger Band, investors wonder whether it’s time to buy the dip. However, technically speaking, buying the dip still requires confirmation of support—not just the fact that the price is low.
Common questions can be grouped into three categories. First, is Alibaba already at a good level to accumulate? The current price is near the lower Bollinger Band, which does create technical conditions for a rebound, but given the decline is supported by increased volume, the risk-reward ratio remains unfavorable until the stock reclaims HK$132.280. Second, could the price fall to HK$115 or HK$110? Current technical support first points to HK$124.732; if that level breaks, the next target would be HK$117.500. HK$110 is not currently indicated as near-term support. Third, can the stock recover above HK$130? If HK$125.500 and HK$124.732 hold firm, a rebound is possible—but for a meaningful recovery, the price must break above HK$132.280.
In terms of short-term strategy, Alibaba’s most critical levels to defend are HK$125.500 and HK$124.732. These levels are near yesterday’s low and the lower Bollinger Band. If they hold, a technical rebound from the lows remains possible. Should the price reclaim HK$132.280, the technical outlook could begin to repair, with the next resistance levels at HK$133.210 and HK$139.828. Notably, HK$132.280 aligns with both the 20-day moving average and the middle Bollinger Band, while HK$133.210 coincides with the 10-day moving average—both situated above the current price and likely to act as near-term resistance during any rebound.
Conversely, if the price breaks below HK$124.732, weakness could persist, with attention shifting to HK$117.500 as the next support level. This doesn’t guarantee the stock will reach HK$117.500, but losing the lower Bollinger Band would shift market sentiment from 'a dip near the band may rebound' to 'breaking below the band extends weakness.' Therefore, both shorting at current lows and attempting to catch a bottom carry risks at this stage. The most prudent approach is to wait for confirmed support or a clear signal of recovery above HK$132.280.
Overall, Alibaba showed clear signs of weakening yesterday. The stock dropped 4.47%, closing near its session low. All key short-term moving averages now sit above the current price, and the share price is approaching the lower Bollinger Band—all while trading volume increased, confirming tangible short-term selling pressure. On the sentiment front, bulls hope for a bounce from the lows and a move back above HK$130; bears worry about ongoing tech-sector selling, capital rotation, and further declines toward HK$117.500 or lower; and those on the sidelines are focused on why the drop occurred, whether it’s safe to buy the dip, and when to take profits on put options. Technically, HK$125.500 and HK$124.732 serve as short-term defense lines, while HK$132.280 is the key threshold for any technical recovery. Until the price reclaims HK$132.280, Alibaba remains in a weak position; if it breaks below HK$124.732, the next support to watch is HK$117.500.
Key trading levels: HK$125.500–HK$124.732 is the short-term support zone. Holding above this range offers a chance to play a technical rebound. A break above HK$132.280 is needed for meaningful recovery, targeting next resistance at HK$133.210 and then HK$139.828. Conversely, a break below HK$124.732 could extend weakness, with initial support seen at HK$117.500.

Strategy 1 | Play a short-term rebound after holding above HK$124.732
$HSALIBA@EC2701A.C (28215.HK)$ | Strike Price: HK$135.60 | Effective Leverage: 4.3x | Strike price is close to the rebound zone between HK$132.280 and HK$139.828, suitable for playing a short-term bounce toward major moving averages once the price holds above the lower Bollinger Band.
$BIALIBA@EC2610B.C (28064.HK)$ | Strike Price: HK$135.00 | Effective Leverage: 5.3x | Offers higher flexibility, ideal for capturing the initial phase of a recovery when the price rebounds from lows and approaches HK$132.280 again.
$UBALIBA@EC2612B.C (27776.HK)$ | Strike price: HK$145.10 | Effective leverage: 4.8x | Higher strike price—suitable for bullish positioning after a confirmed rebound, not for aggressive buying at low levels. Better to wait for the stock price to stabilize above HK$132.280 before entering.
Strategy 2 | Chase recovery after breaking above HK$132.280
$UBALIBA@EC2609B.C (26544.HK)$ | Strike price: HK$145.98 | Effective leverage: 7.0x | Suitable for chasing a rebound after breaking above HK$132.280. Strike price is above the near-term resistance zone, primarily targeting upside elasticity toward HK$139.828.
$UBALIBA@EC2609E.C (27406.HK)$ | Strike price: HK$150.98 | Effective leverage: 8.1x | Higher leverage—suited for quick short-term trades after a breakout. If the stock price only bounces modestly without surpassing HK$133.210, avoid holding for too long.
$UBALIBA@EC2608F.C (26538.HK)$ | Strike price: HK$150.09 | Effective leverage: 8.5x | A more aggressive momentum-chasing option—best used when the stock breaks out with improving trading volume, aiming to capture accelerating rebound momentum.
Strategy 3 | Turn bearish if price falls below HK$124.732
$UBALIBA@EP2608A.P (26410.HK)$ | Strike price: HK$132.78 | Effective leverage: 4.6x | Strike price is above current market price—suitable for direct bearish positioning after a break below HK$124.732, offering sensitivity to near-term downside moves.
$UBALIBA@EP2607B.P (24646.HK)$ | Strike price: HK$122.78 | Effective leverage: 6.9x | Strike price is near the area just below the breakdown level—ideal for capturing downside elasticity toward HK$117.500 after the price breaks below HK$124.732.
$UBALIBA@EP2609C.P (27125.HK)$ | Strike price: HK$109.90 | Effective leverage: 5.7x | Lower strike price—better deployed once further weakness is confirmed. If the stock price breaks below HK$117.500, this is more suitable for extended bearish positioning.
Reply to investor inquiries
@被股打折: If the inverse head-and-shoulders pattern is close to failing, the key will be whether the level around HK$124.732 holds. Short-term risk-reward may look attractive, but remains limited until the price breaks above HK$132.280.
@15097918If holding a Put, short-term profit-taking can watch whether the price breaks below HK$124.732. If it doesn’t break below and rebounds, Put profits may be given back; if it breaks below, the next target is HK$117.500.
@海大炮otzThe level near HK$120 is not the immediate support right now—first watch HK$124.732. Only if the lower band is breached will the price gradually approach HK$117.500.
@232236630Whether the decline is sufficient depends on whether HK$124.732 holds. If it holds, there’s a chance of a technical rebound; if it fails to hold, weakness will likely persist.
Feel free to share your insights in the comment section. For more market analysis, please continue following ‘Hong Kong Stock Warrants Jenny’ for daily updates!
Reminder: This article does not constitute any investment advice.
This article is for reference only and does not constitute any investment advice. Market data, opinions, and analysis contained herein may change at any time without prior notice. We are not responsible for any loss or damage caused by reliance on the information in this article. Technical analysis only shows whether certain technical conditions are met; asset performance should be comprehensively evaluated using other sources of information, and trading decisions should not be made solely based on this article. Please note that past performance is not indicative of future results.
#HKStocks #LiveAnalysis #WarrantPick #WarrantGuide #DerivativesHedging #HKWarrantsJenny #Alibaba #09988 #BlueChipStock #TechnicalAnalysis$Hang Seng Index (800000.HK)$$Hang Seng TECH Index (800700.HK)$
Risk Disclaimer: The above content only represents the author's view. It does not represent any position or investment advice of Futu. Futu makes no representation or warranty.Read more

Comments (2)
to post a comment
3