
Hong Kong Market Barometer: CPO, PCB, and memory stocks rally in rotation! Are you on the right trai
Tencent has fallen to the lower Bollinger Band; it remains weak until it reclaims HK$454.91.
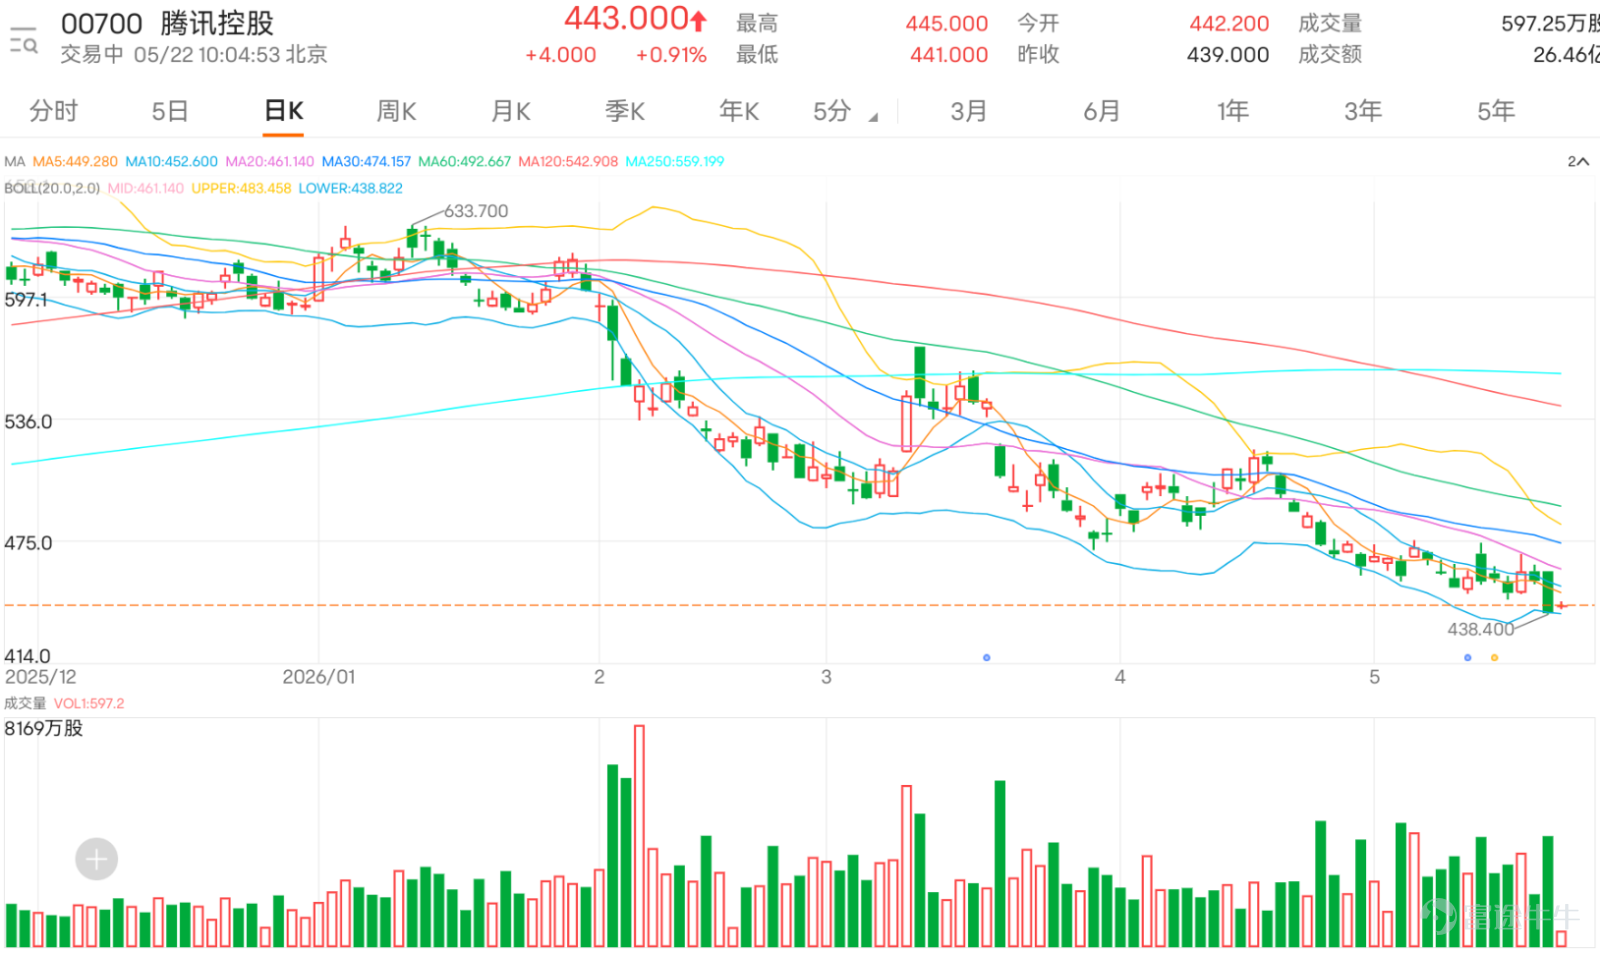
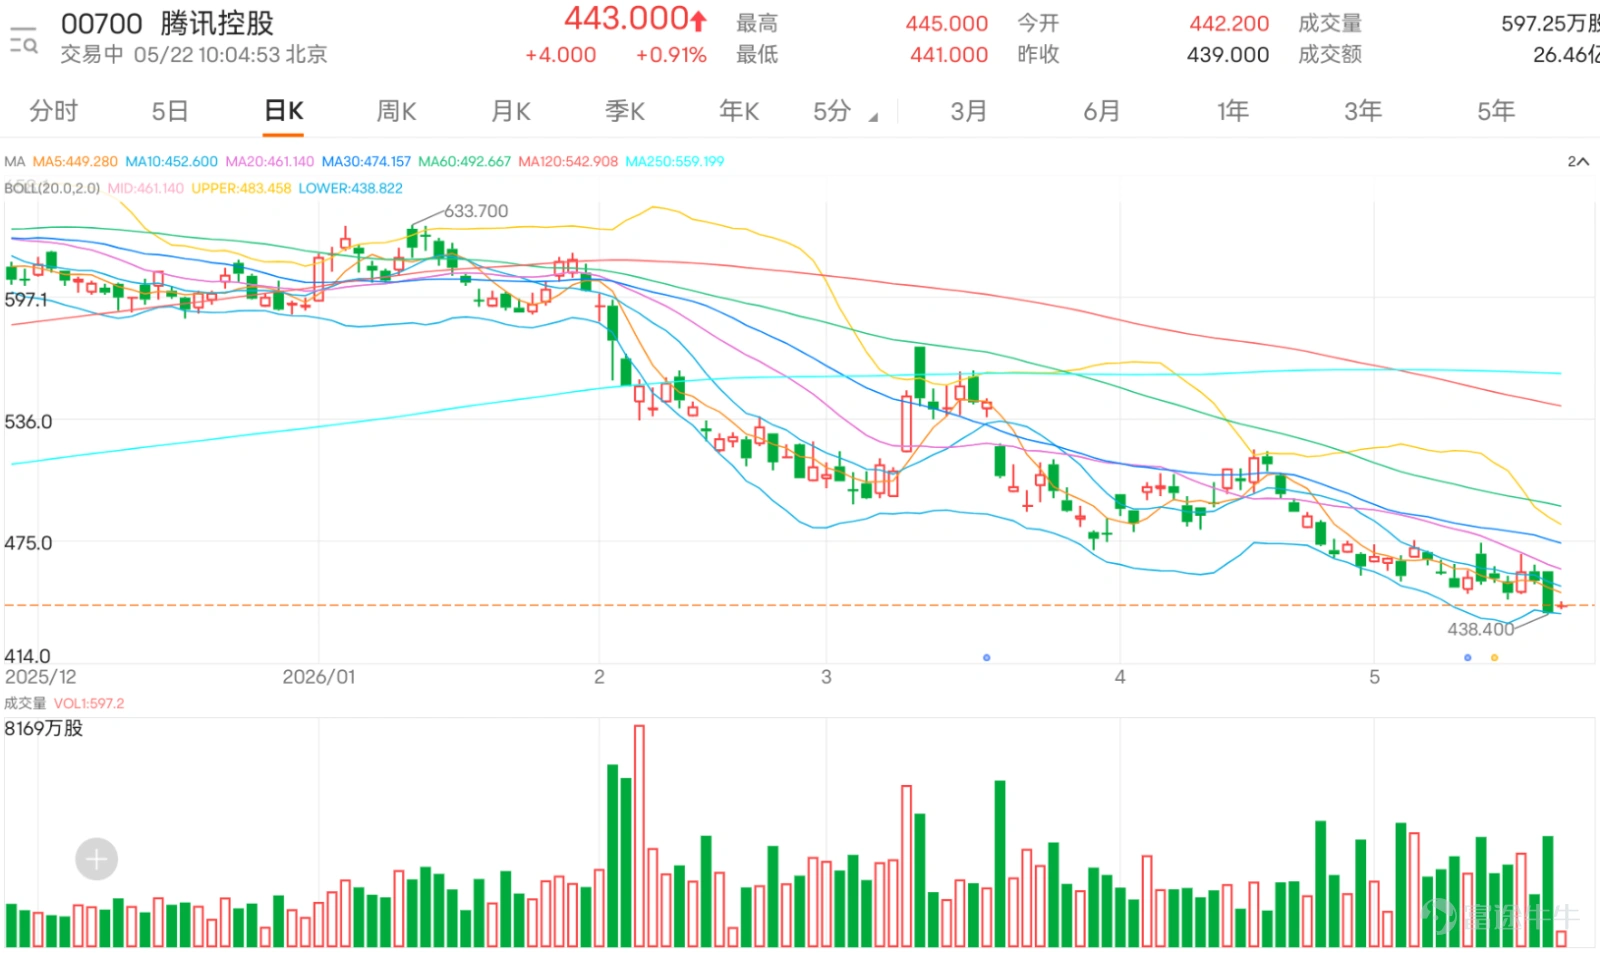
$TENCENT (00700.HK)$ Current price is HK$443, up 0.91%. Today’s high reached HK$445.000, and the low was HK$441.000. Tencent has dropped near the lower Bollinger Band, indicating insufficient buying support above and no clear rebound at the lows. At this stage, it’s premature to assume a bottom simply because the price is nearing the lower band. The key focus should be whether HK$438.400 holds as support and whether HK$454.910 can be reclaimed.
Technically, Tencent’s current price is below the 10-day moving average (MA) at HK$454.910, the 20-day MA at HK$463.485, and the 30-day MA at HK$476.163. All major short-term moving averages are above the current price, confirming continued short-term weakness. The 10-day MA at HK$454.910 has become the first resistance level for any rebound—if the stock fails to stabilize above this level, any rally should be viewed as a weak technical bounce rather than a sign of strength. HK$460.000 was today’s high and serves as the immediate short-term resistance; beyond that lies the 20-day MA at HK$463.485. In other words, for Tencent to repair its technical structure, it needs more than just a minor bounce from the lows—it must first break back above HK$454.910, then challenge HK$460 and HK$463.485.
Regarding Bollinger Bands, the middle band is at HK$463.485, the upper band at HK$487.479, and the lower band at HK$439.491. Tencent has already declined near the lower Bollinger Band. This suggests the stock meets technical conditions for a bounce, yet also reflects that the downtrend has not yet been repaired. If the price stabilizes above HK$438.400 after testing the lower band and then breaks back above HK$454.910, it could signal the start of a bottoming process. However, if even HK$438.400 is breached, weakness may persist, and attention would shift to support around HK$428.
The Relative Strength Index (RSI) is around 28.729, indicating an oversold condition with still-insufficient momentum. This level often triggers two opposing market reactions: some investors see the stock as sufficiently discounted and consider buying the dip, while others fear further downside after breaking below the lower Bollinger Band. Technically, both views have merit. A low RSI does suggest short-term rebound potential, but the price remains below multiple key moving averages, and the decline is supported by volume—so a bottom hasn’t been confirmed. Therefore, the most prudent stance now is: avoid shorting at these lows, but also refrain from aggressively establishing long positions until the stock reclaims HK$454.910.
In terms of trading volume, yesterday’s turnover was approximately 39.65 million shares, higher than the previous day—indicating a decline on elevated volume. A falling price accompanied by rising volume reflects selling pressure backed by actual transactions, which is more concerning than a decline on low volume. A low-volume pullback might simply reflect temporary lack of buying interest, whereas increased volume during a drop signals clearer capital outflows or active selling pressure. This also implies limited short-term risk-reward appeal—even if the price approaches the lower Bollinger Band, confirmation of support is still needed before considering entry.
From key comments, market sentiment is clearly bearish. Bulls are primarily focusing on levels like HK$440, HK$430, and HK$400, viewing those as potential zones to accumulate on dips, while others believe the stock still has long-term upside potential. Such comments reflect that some retail investors still see Tencent as a buy-on-dip candidate, but their target entry prices have clearly shifted lower—from previously higher levels down to HK$440, HK$430, or even HK$400. This indicates that while buying interest hasn’t vanished, investors are now more cautious and willing to wait for significantly lower prices before stepping in.
However, bulls face the issue that the price reaching the lower Bollinger Band suggests buying support at these lows has so far failed to overcome selling pressure. To consider the area around HK$439 as successful short-term defense, the price must first hold above HK$438.400 and then reclaim HK$454.910. Otherwise, we can only say the stock has reached an oversold level—not that it has regained strength.
Bearish comments are more concentrated and intense. Many market participants are citing targets such as HK$430, HK$400, HK$380, HK$350, or even lower levels. Some investors believe the stock is drifting lower and will continue declining after breaking below HK$440. While some of these targets are distant, the sentiment is clear: Tencent has broken below key short-term moving averages and, despite nearing the lower Bollinger Band, has shown no clear rebound. Technically, the most critical level for bears to watch is HK$438.400. If this level is breached, market focus will quickly shift to support near HK$428; if HK$428 also fails to hold, discussions about a move toward HK$400 will intensify.
Comments expressing uncertainty or seeking advice reveal significant stress among existing holders. Some ask why the stock is plummeting, others whether they should exit, some mention buying at HK$530 and feeling trapped, and others wonder if it’s still viable to go long or short. All these questions point to one reality: Tencent’s decline is hurting not just short-term speculators but also eroding the confidence of investors who assumed large-cap blue chips were relatively stable. With the price breaking below multiple moving averages and approaching the lower Bollinger Band, what holders need most isn’t speculation about distant targets—but clarity on where the immediate defensive line lies. That line is HK$438.400; if it fails, the next support zone is around HK$428.
Common questions can be grouped into three categories. First, whether Tencent is worth buying on dips. While the price approaching the lower Bollinger Band does create technical conditions for a bounce, the accompanying rise in volume on the decline suggests the reward-to-risk ratio remains low until the stock reclaims HK$454.910. Second, whether the price could fall to HK$430 or HK$400. If HK$438.400 is breached, support would likely shift to the HK$428 area; HK$400 is not currently a near-term technical support level, but if weakness persists, market discussions around this target will naturally increase. Third, whether one should exit positions. This depends on individual cost basis and risk tolerance, but technically, HK$438.400 serves as the short-term defense line—breaking below it increases risk, whereas holding above it and reclaiming HK$454.910 would offer a chance for the trend to recover.
In terms of short-term strategy, Tencent is currently not suitable for aggressive buying on rallies nor for blind shorting at lower levels. For long positions aiming to capture a rebound, the first step is to monitor whether the price can hold steady above HK$438.400. The second step is a break back above HK$454.910. Only if the stock breaks above HK$454.910 will there be a chance for technical recovery, with the next resistance levels to watch at HK$460.000 and HK$463.485. HK$460 marks the recent two-day high, while HK$463.485 aligns with the 20-day moving average and the middle Bollinger Band; sustained recovery toward these levels would help restore short-term market confidence.
Conversely, if the share price falls below HK$438.400, weakness may persist, and support near HK$428 should be monitored. Although the price is already approaching the lower Bollinger Band and the Relative Strength Index (RSI) remains weak, a breakdown does not necessarily mean risk-free shorting opportunities. However, for existing long holders, this would signal increased risk. At this stage, the clearest tactical plan is: defend HK$438.4, target HK$454.91; only after reclaiming HK$454.91 can talk of recovery begin; if HK$438.4 is breached, prepare for a test of support around HK$428.
Overall, from a technical perspective, HK$438.400 serves as the first line of short-term defense, while HK$454.910 acts as the key threshold for potential recovery. Until Tencent reclaims HK$454.910, it remains in a weak position; if it breaks below HK$438.400, attention shifts to support near HK$428.May 21 [HK Stock Podcast] Part-1 – Hang Seng Index, Sunny Optical, Tencent
Key tactical points: HK$438.400 is the short-term support level—holding above it allows for a play on a technical rebound; only a breakout above HK$454.910 creates conditions for recovery, with the next targets at HK$460.000 and HK$463.485; if HK$438.400 is breached, weakness may extend, with initial support seen around HK$428.
Strategy One | Play for a short-term rebound after holding above HK$438.400
$UBTENCT@EC2706A.C (27993.HK)$ | Strike Price: HK$500.50 | Effective Leverage: 4.8x | The strike price is above the near-term resistance zone, offering moderate leverage—suitable for a relatively stable rebound play once the stock holds above HK$438.400.
$HSTENCT@EC2706A.C (28585.HK)$ | Strike Price: HK$500.50 | Effective Leverage: 5.0x | Slightly higher flexibility—ideal when the stock rebounds from lower levels and approaches HK$454.910, focusing on capturing the early phase of technical recovery.
$CITENCT@EC2706A.C (27367.HK)$ | Strike Price: HK$500.00 | Effective Leverage: 4.7x | Offers milder leverage, suitable for those seeking a rebound without chasing excessive volatility. If the stock fails to break above HK$454.910, avoid holding the position for too long.
Strategy Two | Chase recovery after breaking above HK$454.910
$GJTENCT@EC2611A.C (28879.HK)$ | Strike Price: HK$557.00 | Effective Leverage: 8.4x | With a relatively high strike price, this option is suitable for chasing the rebound only after confirmation of a breakout above HK$454.910, primarily targeting short-term upside momentum toward HK$460.000 and HK$463.485.
$BITENCT@EC2611A.C (28772.HK)$ | Strike price: HK$555.00 | Effective leverage: 9.1x | Higher leverage, suitable for quick short-term trades after a breakout. If the stock price only bounces back without stabilizing above the key resistance level, avoid holding stubbornly.
$UBTENCT@EC2706A.C (27993.HK)$ | Strike price: HK$500.50 | Effective leverage: 4.8x | Better suited for steady follow-through after a breakout. Lower elasticity compared to high-leverage options, but more appropriate for waiting for a recovery continuation rather than chasing intraday spikes.
Strategy 3 | Turn bearish if price breaks below HK$438.400
$UBTENCT@EP2610A.P (27468.HK)$ | Strike price: HK$408.68 | Effective leverage: 7.2x | Strike price below current market price, suitable for bearish positioning following a break below HK$438.400, primarily targeting downside elasticity toward the HK$428 area.
$HUTENCT@EP2610A.P (27610.HK)$ | Strike price: HK$408.68 | Effective leverage: 7.3x | Slightly higher leverage, suitable for short-term bearish trades after a breakdown. Avoid early positioning if the stock price hasn’t broken below HK$438.400.
$BPTENCT@EP2611B.P (27089.HK)$ | Strike price: HK$399.80 | Effective leverage: 6.9x | Lower strike price, suitable once further weakness is confirmed. Can be used for extended bearish positioning if the stock price breaks below the HK$428 area.
Reply to investor inquiries
@1596328: HK$400 is not currently a near-term technical support level. Focus first on the HK$438.400 and HK$428 areas.
@坚持自律大磊哥: To confirm a primary downtrend, we first need to see whether HK$438.400 holds. If it breaks, the next target is around HK$428.
@17065472: HK$200 lacks current technical support. The more immediate short-term supports are around HK$438.400 and HK$428.
@MrSo: If aiming to exit at HK$460, the first step is reclaiming HK$454.910. If the price breaks below HK$438.400, short-term downward pressure will intensify.
@萬牛Many people buying the dip doesn't necessarily mean the bottom has been reached. Technically, we need to watch whether the level of HK$438.400 holds and if the price can reclaim HK$454.910.
Feel free to share your insights in the comment section. For more market analysis, please continue following ‘Hong Kong Stock Warrants Jenny’ for daily updates!
Reminder: This article does not constitute any investment advice.
This article is for reference only and does not constitute any investment advice. Market data, opinions, and analysis contained herein may change at any time without prior notice. We are not responsible for any loss or damage caused by reliance on the information in this article. Technical analysis only shows whether certain technical conditions are met; asset performance should be comprehensively evaluated using other sources of information, and trading decisions should not be made solely based on this article. Please note that past performance is not indicative of future results.
#HKStocks #LiveAnalysis #WarrantPick #WarrantGuide #DerivativesHedging #HKWarrantsJenny #Tencent #00700 #BlueChipStock #TechnicalAnalysis$Hang Seng Index (800000.HK)$$Hang Seng TECH Index (800700.HK)$
Risk Disclaimer: The above content only represents the author's view. It does not represent any position or investment advice of Futu. Futu makes no representation or warranty.Read more

Comments (2)
to post a comment
1