
What to Watch in US Stocks | NVIDIA's Annual Shareholder Meeting Is Here—Why Even Beginners Should T
Bull Bull Technical Intelligence | FSD Enters China + SpaceX IPO: A One-Two Punch! AI Chip Stocks Stage a Strong Rebound—In-Depth Technical Analysis of Key Levels for Tesla and Intel
AI chip stocks collectively rebounded in the previous trading session, with $Intel (INTC.US)$ posting the strongest gains, surging more than 10% intraday and closing up 7.36% at $118.96.; $Tesla (TSLA.US)$ has been declining since its failed attempt on May 14 to break through the key $450 level,but recently stabilized above its 20-day moving average and staged a strong rebound, ultimately closing up 3.25% at $417.26.Tesla’s two key near-term catalysts:the rollout of its Full Self-Driving (FSD) technology and SpaceX’s IPO have both made tangible progress—Tesla officially announced the launch of its supervised FSD version in China, and SpaceX is expected to go public in mid-June.
This edition of Bull Bull’s Technical Intelligence Brief will focus on whether the recent pullbacks in Intel and Tesla have ended, and highlight key factors needed for both stocks to sustain their upward trends.
Tesla (TSLA)
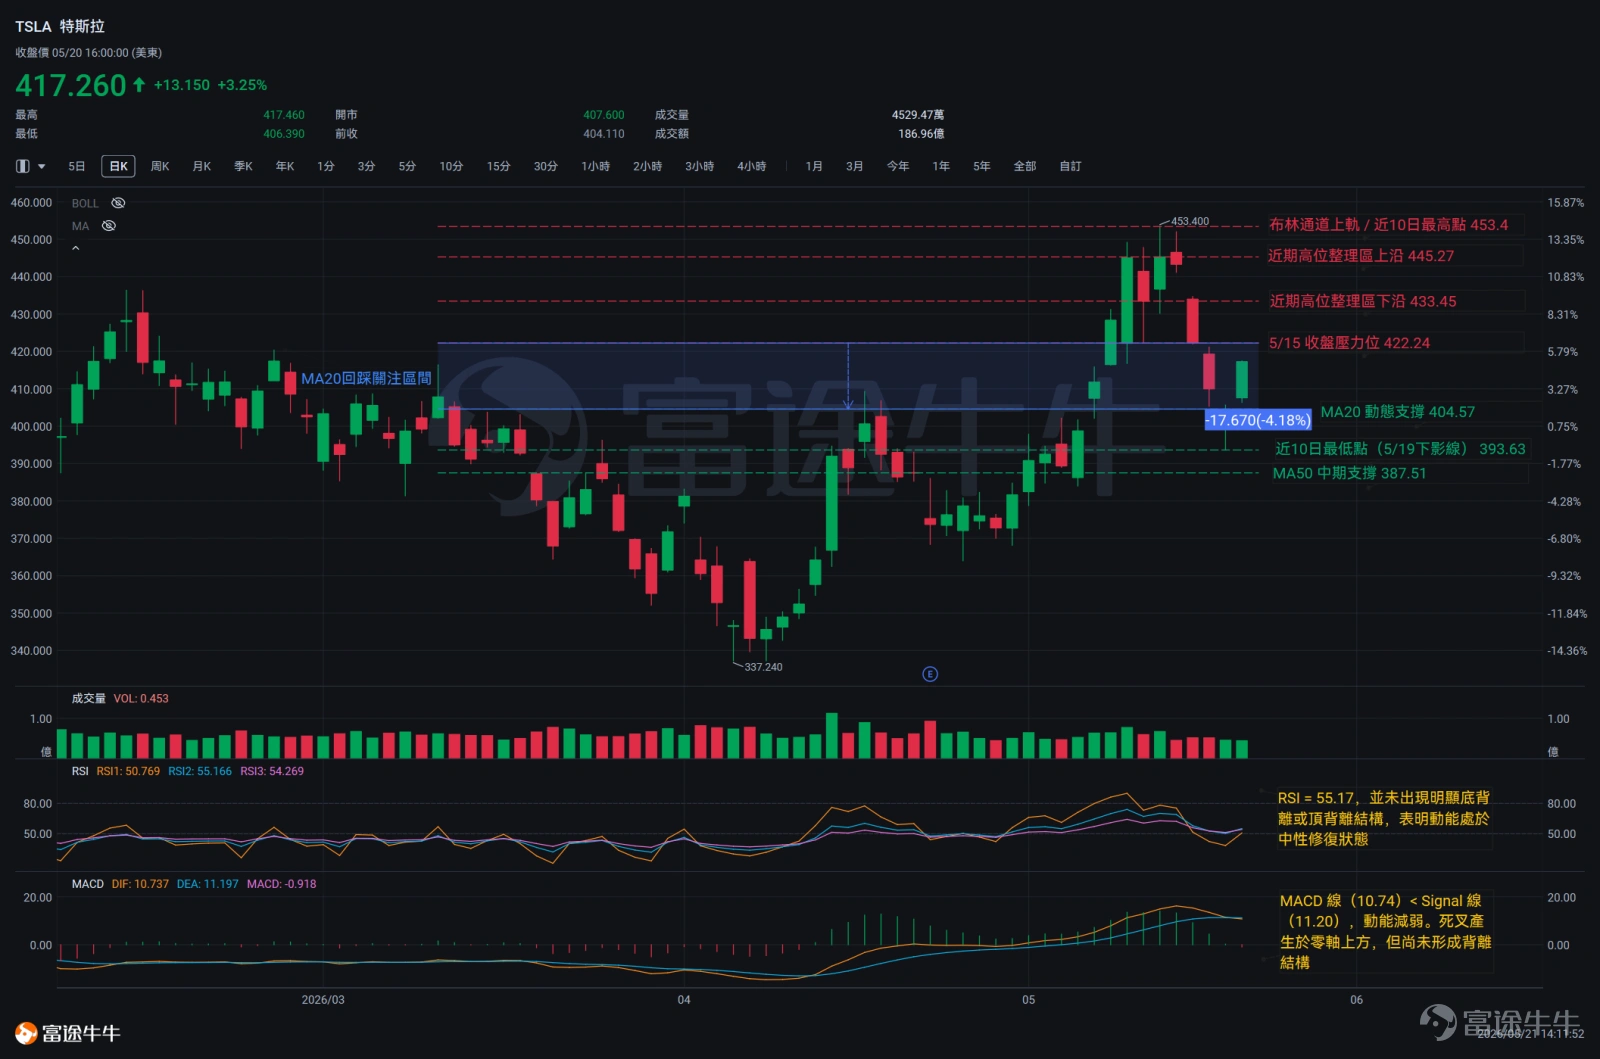
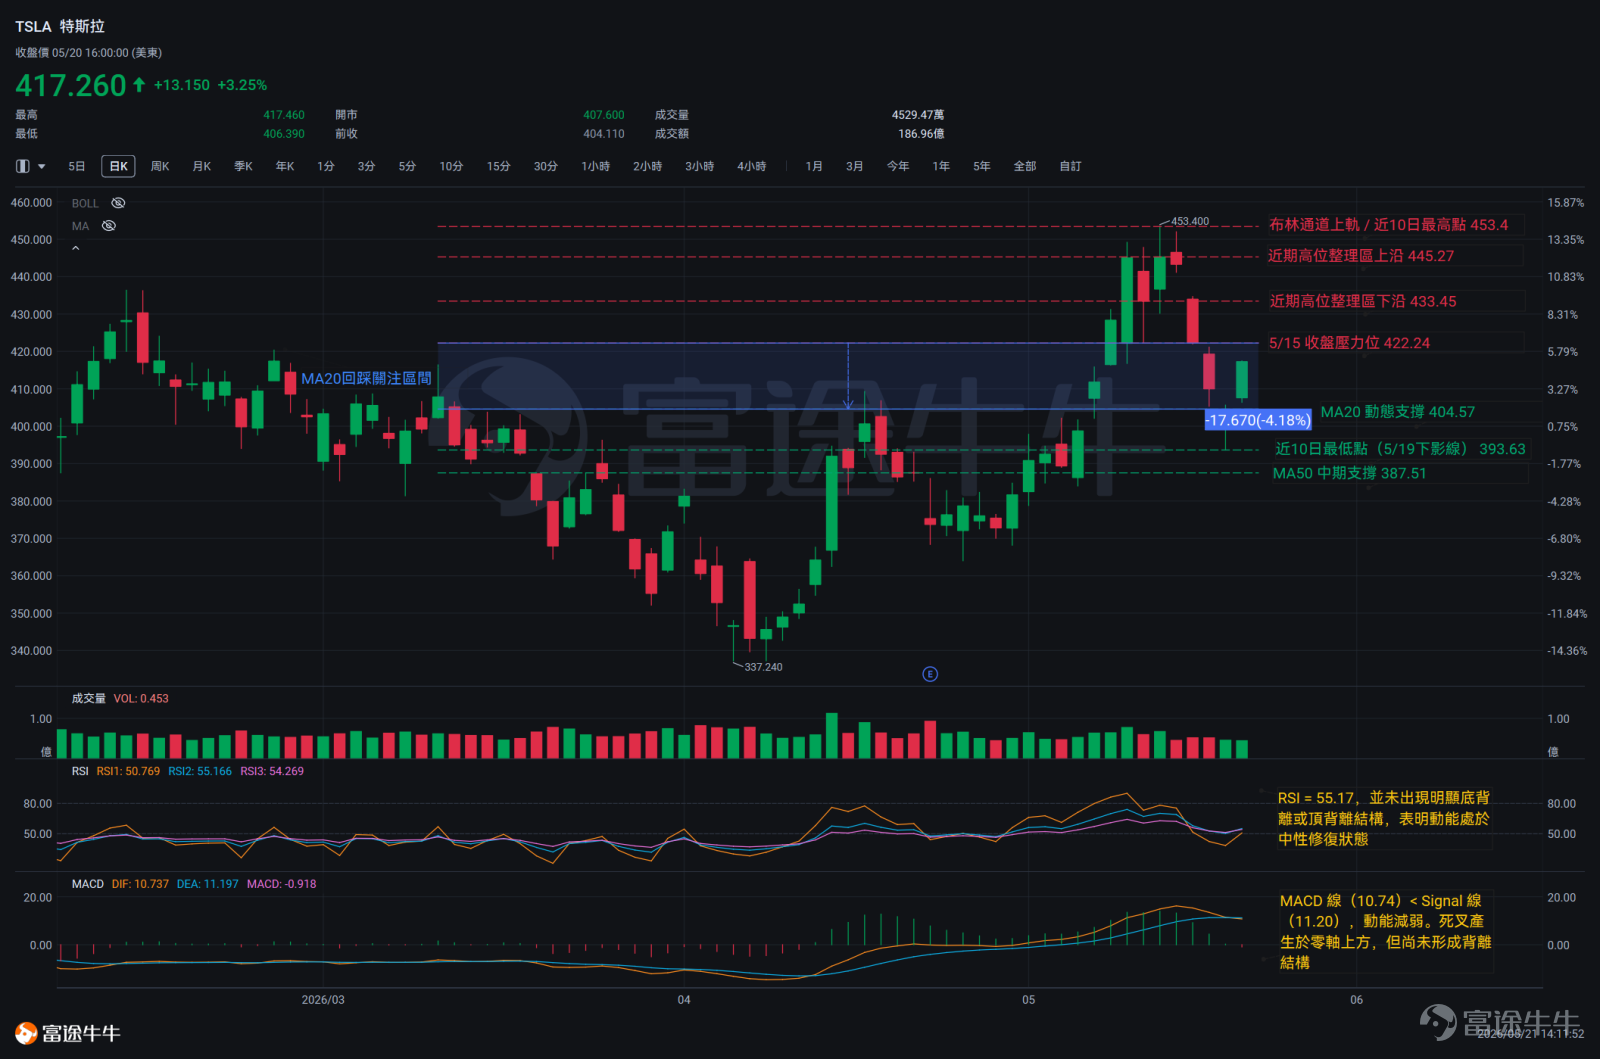
Tesla’s current share price stands at $417.26. Overall, the price remains firmly above both the 20-day short-term moving average ($404.57) and the 50-day medium-term moving average ($387.51), indicating a solid foundation for a medium-term uptrend. However, in the short term, the price has experienced notable volatility and pullbacks.The stock is currently in a stabilization phase. Recent price action has shown a pattern of pulling back from highs and finding support at lows due to buying interest.
Between May 11 and May 13, Tesla’s share price briefly touched the $453 high range but failed to convincingly break through the key psychological level of $450. On May 14, it generated a significant top warning signal—That day, the price surged to an intraday high of $451.98 but closed lower at $443.30, leaving a very long upper wick, signaling that upward momentum had hit a ceiling.
After consecutive declines, on May 19, the price dipped as low as $393.63 but ultimately closed at $404.11, forming a bottom-reversal candlestick pattern with an extremely long lower wick—This indicates strong buying interest emerging at deeply oversold levels. The following day, May 20, the price rebounded to $417.26, further confirming the validity of the bottom.
Key Technical Indicators Interpretation
Moving Average (MA):The current share price is above the 20-day moving average (MA20), which in turn is above the 50-day moving average (MA50), maintaining a bullish alignment with an intact intermediate-term uptrend.
RSI:The current RSI reading is 55.17. From a cyclical perspective, RSI has retreated from overbought territory—corresponding to the $445–$453 price zone—to around 55, without showing clear bullish or bearish divergence, indicating that momentum is in a neutral correction phase.
MACD:The MACD line (10.74) is below the Signal line (11.20), reflecting weakening momentum. The bearish crossover occurred above the zero axis, representing a moderately weak correction signal rather than a trend reversal. This suggests short-term selling pressure has not been fully exhausted, though no divergence structure has yet formed.
Bollinger Bands:The current price of $417.26 sits in the middle portion between the Bollinger Bands’ midline and upper band. Short-term volatility remains relatively wide. After retreating from near the upper band, the price found support above the midline, with the midline (i.e., the 20-day moving average) serving as the key support level in this pullback.
Technical Comprehensive Analysis
BelowThe primary support level stands at $404.57 (aligned with both the 20-day moving average and the Bollinger Bands midline).If this level is breached, attention should be paid tothe recent extreme low of $393.63.If the downtrend continues, the ultimatemedium-term support lies at $387.51 (the 50-day moving average).
AboveThe first resistance level to overcome is $422.24 (the level where a rebound attempt on May 15 failed).This is followed bythe prior double-top zone between $445 and $445.27,which will require significantly higher trading volume to break through.The final strong resistance zone is between $453.40 and $453.80.
Intel (INTC)
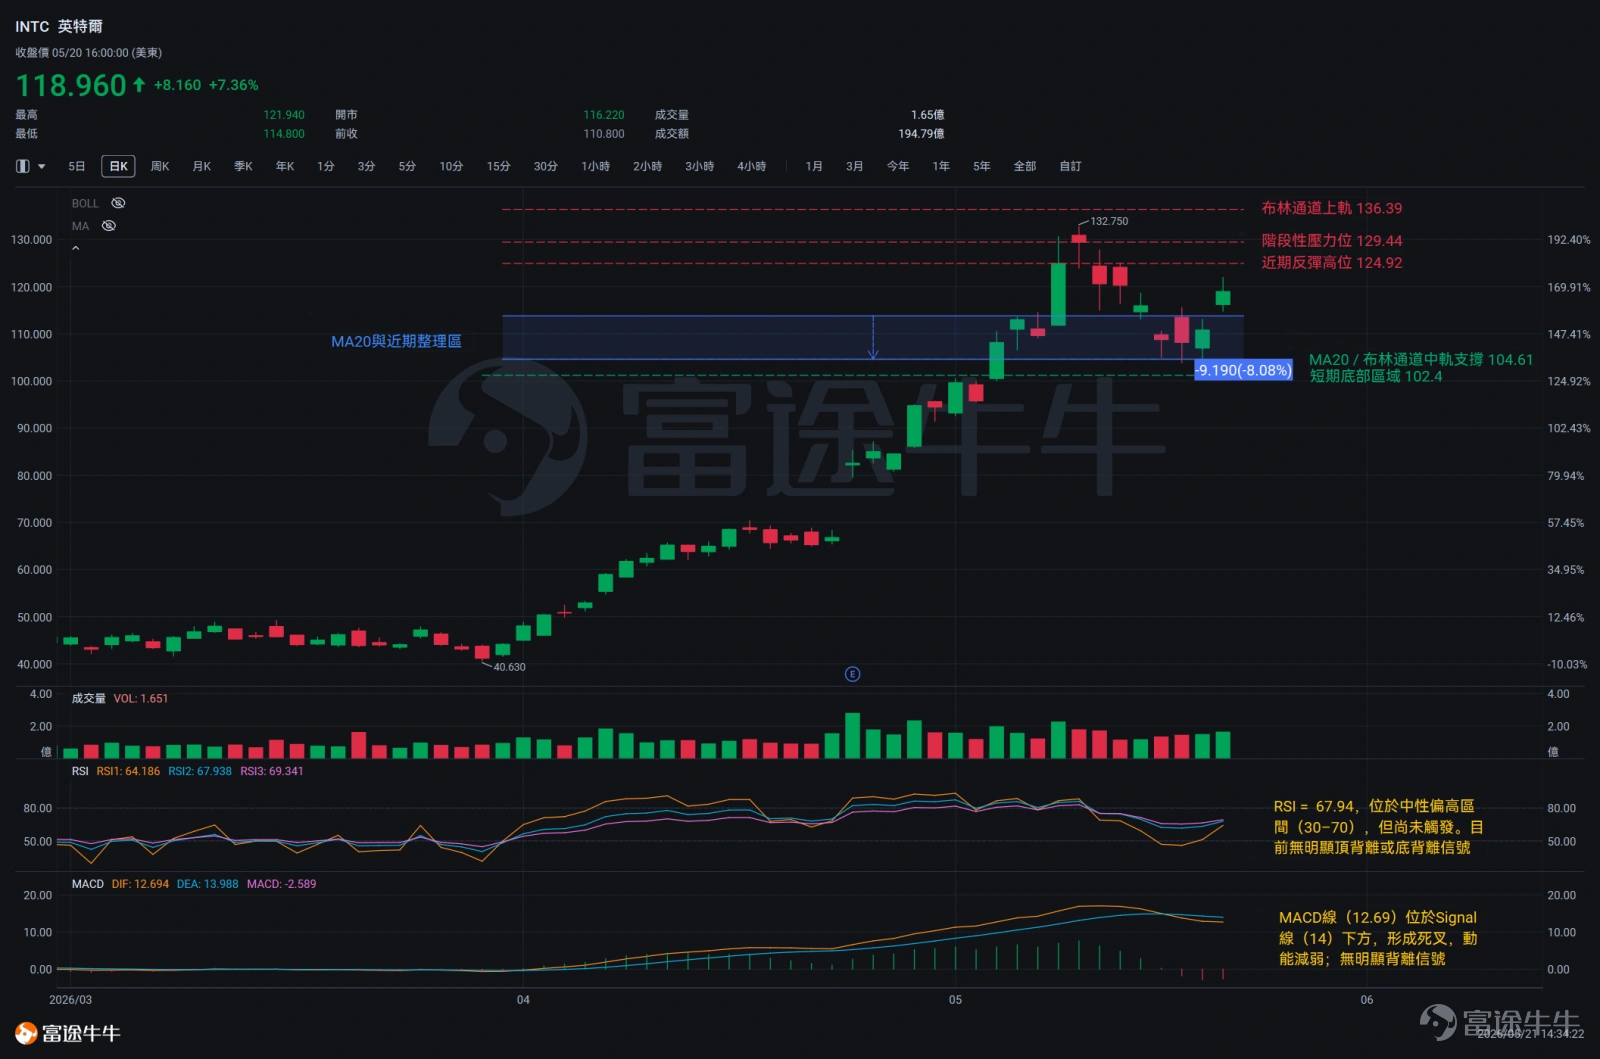
Intel's current share price is $11**milar to Tesla, Intel’s stock also remains above both its 20-day short-term moving average ($104.61) and its 50-day medium-term moving average ($73.54),This confirms that the overall medium- to long-term trend remains bullish. However, market divergence has widened in the short term, and prices are currently in a modest rebound phase following a volatile pullback.
From May 11 to May 13, Intel posted three consecutive days of declines (closing price dropped from $129.44 to $120.29),reflecting sustained selling pressure. The sharp lower openings on both May 11 and May 12 together formed a double-top resistance pattern.
Conditions began to improve after the stock hit a low of $103.85 on May 18.Prices started to stabilize on May 19,and on May 20, the stock opened significantly higher and closed at $118.96.These three days of price action have初步 formed an early reversal pattern.However, it should be noted that since the closing price on May 19 was very close to the previous day's close,this reversal signal is relatively weakand carries uncertainty.Confirmation requires waiting for further price increases on the following day.
Key Technical Indicators Interpretation
Moving Average (MA):The stock price is significantly above both the 20-day and 50-day moving averages. The short-term 20-day MA has an upward slope, but after recently breaking below it and then reclaiming it, the upside resilience above the moving averages has weakened; monitor whether this level holds.
RSI:Current value is 67.94, in the moderately high range (30–70), but no trigger has occurred yet. There are currently no clear bearish or bullish divergence signals.
MACD:The MACD line (12.69) is below the Signal line (14), forming a bearish crossover, indicating weakening momentum. The overall trend remains bullish, but the death cross suggests that short-term upward momentum is fading, with no evident divergence signals.
Bollinger Bands:The price of $118.96 lies between the middle Bollinger Band ($104.61) and the upper band ($136.39), with the bands in an expanding state. The price pulled back before reaching the upper band, reflecting insufficient strength; if it subsequently retreats to the middle band, that level will serve as a critical bull-bear pivot point.
Technical Comprehensive Analysis
Key levels to watch in the near term include:Support at $114.80 (the low from May 20).If this support fails,price could retest the dense trading zone between $108 and $110.Finally,The key medium-term support level is at $104.61 (the location of the 20-day moving average; a break below this level suggests the medium-term structure could weaken).
AboveThe first resistance zone lies between $120.29 and $120.61 (recent attempts to break above this range have repeatedly failed).If it successfully breaks through,the next target is $124.92 (the closing price range from the sharp rally on May 8).The strongest resistance remains in the recent high range,specifically between $129.44 and $132.75; only a breakout above this zone would confirm a sustained rebound from higher levels and signal strengthening momentum.

Here’s some good news for everyone: the new 'AI Custom Indicator' feature has just launched on the NiuNiu desktop platform!
Want your own custom indicator? Now, just give a simple instruction and AI will generate it for you! Plus, you can backtest with one click—no coding required—and instantly see your potential returns. Give it a try today!
Risk Disclaimer: The above content only represents the author's view. It does not represent any position or investment advice of Futu. Futu makes no representation or warranty.Read more


Comment (1)
to post a comment
22
22