HSBC is trading near the Bollinger Bands middle band at HK$140.6; RSI at 58 is not overheated, indicating neutral technical signals.
HSBC Holdings (00005) closed at HK$141.5 on May 21, up 2.02%, with a turnover of HK$1.653 billion, showing a pattern of narrow-range consolidation in the short term. The share price is currently between short-term moving averages—above the 10-day MA at HK$139.85 and the 60-day MA at HK$135.68, yet still below the 30-day MA at HK$140.6—suggesting some underlying support in the near term, though upward momentum has not fully emerged. The stock is now at a critical juncture awaiting directional clarity. Regarding Bollinger Bands, the middle band is around HK$140.6, with the upper band at approximately HK$149.1 and the lower band at HK$132.1. The current price of HK$141.9 is close to the middle band, placing it in a neutral zone with room to move higher and downside cushion. The Relative Strength Index (RSI) stands at 58, in a moderately strong but neutral range—not overbought nor oversold—indicating potential for further price movement.
Multiple oscillator indicators are showing neutral signals: the stochastic oscillator is neutral, the CCI indicator is neutral, the ADX is also neutral, while the MACD is issuing a buy signal. The Bollinger Bands remain neutral, and both the Bulls vs. Bears Power indicator and the Rate of Change indicator are generating buy signals. The composite technical signal is neutral, with a strength rating of 9, reflecting that HSBC is currently in a consolidation phase near its moving averages, with direction unclear but no evident signs of structural weakening. The five-day price amplitude is approximately 4.9%, indicating relatively limited recent volatility and suggesting short-term investors are adopting a wait-and-see stance.
Support and Resistance Level Analysis
On the downside, HK$138 is the first key support level. This lies just below the 30-day moving average and represents an area likely to attract short-term buying interest if the stock pulls back from current levels. HK$133.8 serves as the second line of defense, situated near the 60-day MA at HK$135.68. Should the price break below HK$138 and continue to decline, HK$133.8 will become the next critical level to watch.
On the upside, HK$145.9 is the most immediate technical resistance, corresponding to a key resistance zone just below the Bollinger Bands upper band. HK$150 marks the second resistance level; if the stock can decisively break above HK$145.9 and hold steady, it would be well-positioned to test the HK$150 mark—a level close to JPMorgan’s target price of HK$150.5.
Warrant Product Review
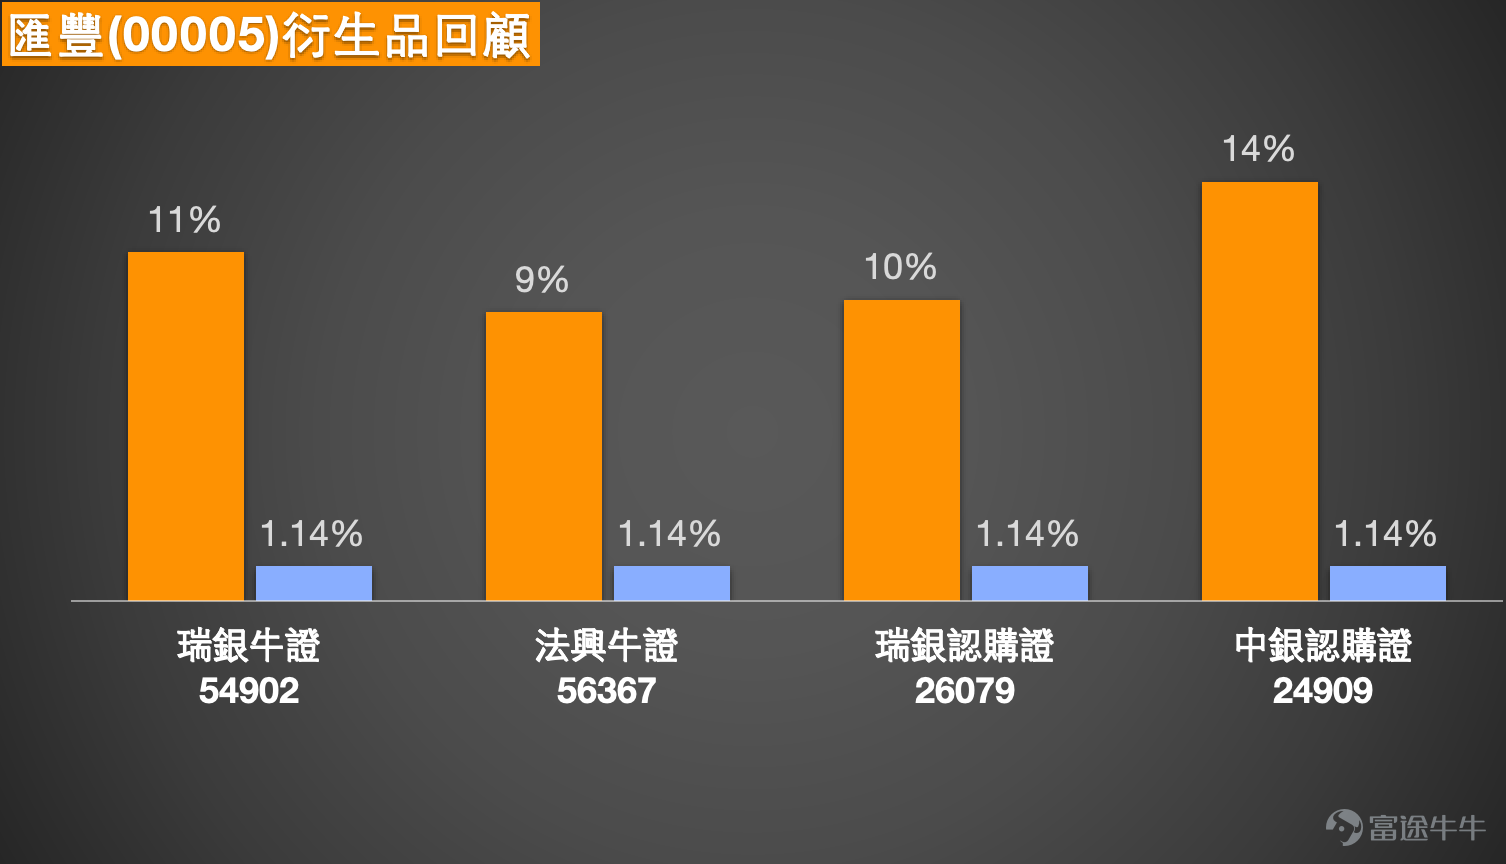
HSBC-linked warrants and CBBCs mentioned on May 19 posted varying degrees of gains over the two trading days through May 21. During this period, HSBC’s underlying share price rose 1.14%. The Societe Generale CBBC on HSBC (56367) gained 9% over the two days, demonstrating that at-the-money CBBCs can still capture steady price movements even during modest upward moves in the underlying. The UBS Group CBBC on HSBC (product code not provided) rose 11%, outperforming others. Meanwhile, the UBS Group call warrant (26079) and Bank of China call warrant (24909) on HSBC recorded gains of 10% and 14%, respectively. Among them, the Bank of China call warrant (24909) delivered the strongest performance in this group with a 14% gain, illustrating that selecting appropriately structured call warrants can effectively track moderate underlying stock appreciation. These figures indicate that within HSBC’s current trading range of HK$138 to HK$145.9, deploying at-the-money CBBCs or moderately out-of-the-money call warrants can yield reasonable returns even with limited underlying price movement. $UB#HSBC RC2809K.C (54902.HK)$$SG#HSBC RC2809I.C (56367.HK)$$UB-HSBC@EC2612A.C (26079.HK)$$BI-HSBC@EC2608A.C (24909.HK)$

Replying to investor comments one by one
@花開富貴: To reach HK$141, the stock must first break through the HK$139.748–HK$140 range; otherwise, it remains vulnerable to downward pressure.
@@史諾比與胡斯托: A rebound to HK$140 is the first psychological market target, but it must first reclaim HK$139.748.
@初學者1017: Higher U.S. Treasury yields theoretically benefit bank net interest margins, but share prices remain subject to short-term technical pressure and overall market sentiment.
@冬寶: For further upside, the stock needs to first reclaim the HK$140 level; otherwise, it will likely consolidate near current highs.
HSBC Holdings (00005) Key Strategy: In the short term, defend HK$138.100. If this level holds, wait for a rebound and recovery. Only if the price reclaims HK$139.748 can it test HK$143.244. If it breaks below HK$138.100, short-term momentum weakens, with next support around HK$136.252–HK$135.300.
Strategy One | Bet on a rebound after holding above HK$138.100
26928 | Strike Price HK$138.88 | Effective Leverage 8.1x | Strike price close to current share price—suitable for a near-the-money rebound play if the stock holds above HK$138.100, primarily targeting the recovery move back toward HK$139.748.
27220 | Strike Price HK$138.98 | Effective Leverage 9.0x | Higher leverage—ideal for a short-term rebound after stabilizing at lower levels; reaction will be more direct if the price approaches HK$140 again.
25899 | Strike Price HK$142.88 | Effective Leverage 9.0x | Strike price above the near-term pivot point—best deployed only after the stock breaks above HK$139.748, to capture the potential move from around HK$140 toward HK$143.244.
Strategy 2 | Break above HK$139.748 to test HK$143.244
26077 | Strike price HK$143.88 | Effective leverage 10.0x | Strike price close to the upper target zone of HK$143.244, suitable for short-term rebound plays after breaking above HK$139.748, offering higher flexibility.
26847 | Strike price HK$148.98 | Effective leverage 11.2x | Higher strike price, suitable for use when share price breaks out and trading volume improves; positioned as an aggressive momentum-chasing play, not suitable for early deployment before breakout.
26806 | Strike price HK$148.98 | Effective leverage 10.9x | Similarly aggressive in nature, suitable for capturing continued upside momentum after confirming a move back above short-term moving averages; better used when the share price stabilizes above HK$140.
Strategy 3 | Break below HK$138.100 signals weakness, targeting HK$136.252 to HK$135.300
28725 | Strike price HK$128.88 | Effective leverage 6.2x | Strike price below current price, suitable for bearish positioning after breaking below HK$138.100; leverage is not overly aggressive, making it more suitable for capturing the initial phase of weakening momentum.
28920 | Strike price HK$128.00 | Effective leverage 5.7x | Lower leverage, suitable for conservative bearish positioning when the share price breaks support but hasn't yet experienced a sharp drop; offers higher resilience to volatility.
25460 | Strike price HK$126.56 | Effective leverage 13.9x | Significantly higher leverage, suitable for chasing accelerated downside momentum after confirming a break below HK$138.100; primarily targets the decline extending toward HK$136.252 to HK$135.300.
Reminder: This article does not constitute any investment advice.
This article is for reference only and does not constitute any investment advice. The market data, views, and analysis contained herein may change at any time without prior notice. We are not responsible for any loss or damage caused by reliance on the information in this article. Technical analysis only shows whether certain technical conditions are met; asset performance should be comprehensively evaluated with other data. Trading decisions should not be made solely based on this article. Please note that past performance is not indicative of future results. Follow Jenny's HK Stock Warrants for more professional insights.
Risk Disclaimer: The above content only represents the author's view. It does not represent any position or investment advice of Futu. Futu makes no representation or warranty.Read more


Comments
to post a comment
2