
Xiaomi announces a new HK$20 billion share buyback program—will the stock price get a boost?
Xiaomi repeatedly tests the 30 HKD support level, testing retail investors' patience
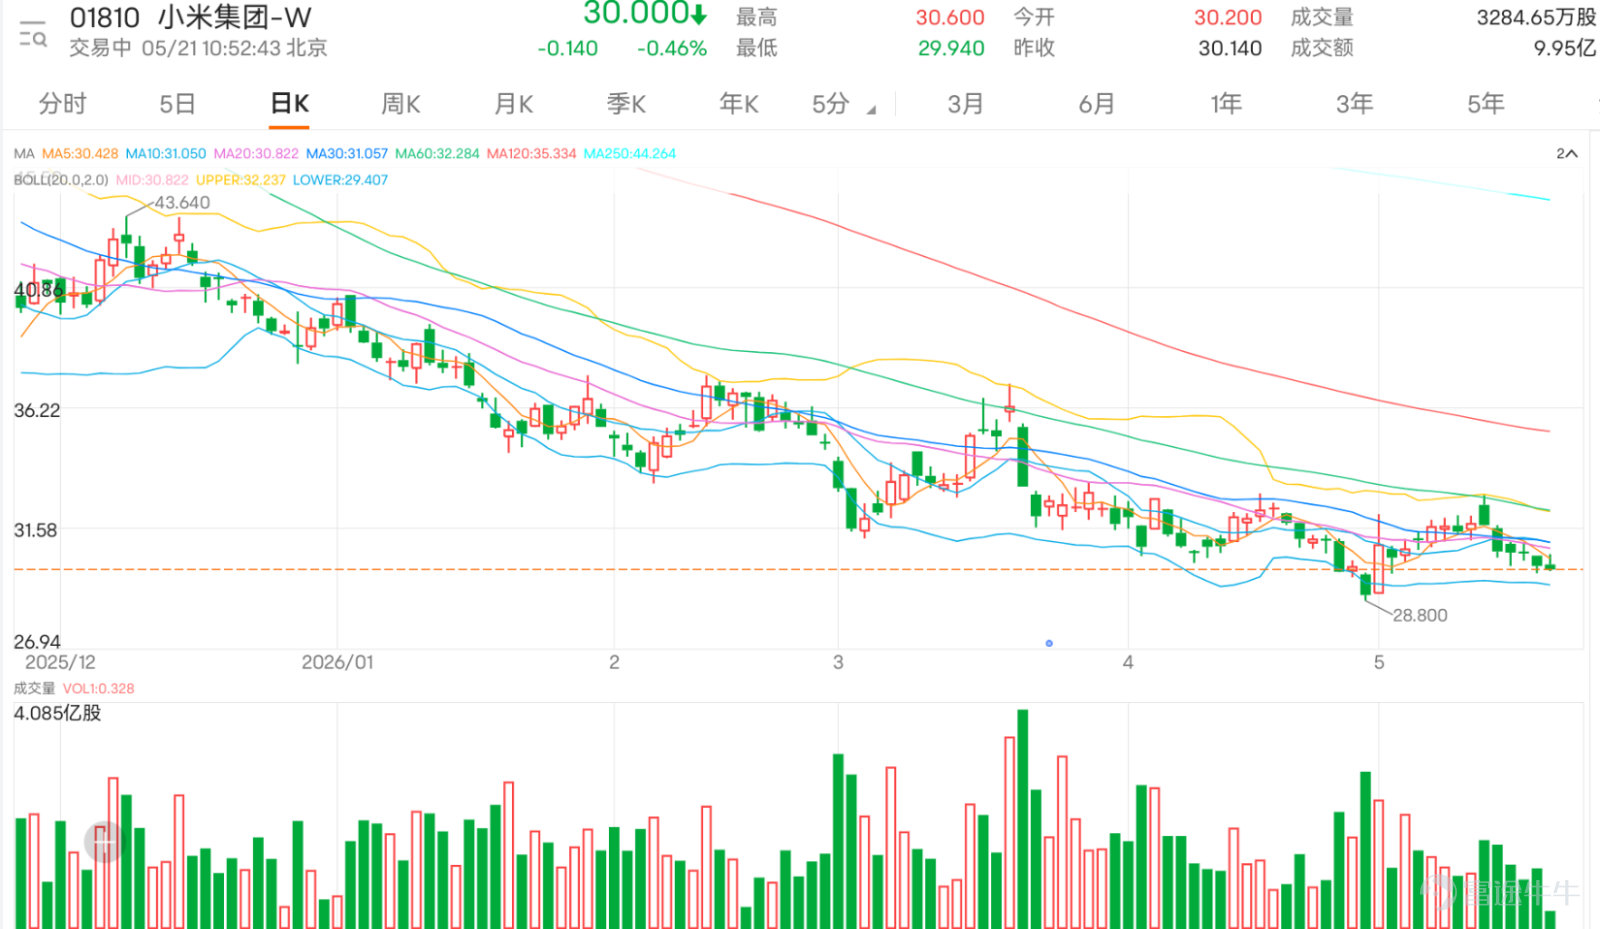
$XIAOMI-W (01810.HK)$ Latest price: HKD 30. The current price remains below the 10-day moving average (MA) at HKD 31.162, the 20-day MA at HKD 30.912, and the 30-day MA at HKD 31.149, indicating a still weak short-term moving average structure. The real key isn’t whether the HKD 30 level holds once, but whether the stock can break back above the critical range of HKD 30.912 to HKD 31.162.
Comment sentiment is highly contradictory. On one hand, many investors have noticed apparent support near HK$30. Some describe HK$30 as having formed multiple bottoms already, while others refer to it as an 'unbreakable stainless-steel floor' or 'Lei Jun’s bottom line.' Some comments even note that bears aggressively tried to drive the price down but still failed to break below HK$30. Such remarks reflect a degree of market consensus around HK$30 as a psychological support level, with some retail investors believing that over a month of sideways consolidation near HK$30 may signal the final stage of a shakeout.
However, this HK$30-level defense has not translated into real conviction for buying. Many comments remain filled with disappointment, exhaustion, and doubt. Some investors say they’ve suffered painful losses holding Xiaomi shares, while others believe product performance and stock price influence each other—weak share prices even sap confidence among Xiaomi fans ('Mi Fans'). Others mention that product launches often lead to declines, that Xiaomi fails to rally even during strong AI-related market moves, that trading volume remains lackluster, and that the stock trades as listlessly as if it were a small-cap company. These comments indicate that the market isn’t unaware of Xiaomi’s potential catalysts—it simply doesn’t believe those catalysts can immediately translate into a breakout in share price.
Technically, Xiaomi’s nearest support level is HKD 29.860, followed by the lower Bollinger Band at HKD 29.489, with the next major support at HKD 28.800. As long as the stock holds within the HKD 29.860–29.489 range, it still has a chance to consolidate sideways at low levels and attempt to challenge HKD 30.540, HKD 30.912, and HKD 31.162 again. However, if HKD 29.489 is breached, it would signal a breakdown below the lower Bollinger Band support, extending the downtrend, with the next support level seen near HKD 28.800.
Upside resistance is even more critical. HKD 30.540 is the immediate short-term resistance, but the true make-or-break zone lies between HKD 30.912 and HKD 31.162. The 20-day MA sits at HKD 30.912, the 10-day MA at HKD 31.162, and the 30-day MA is also close to HKD 31.149—these three short-term moving averages are clustered around HKD 31, forming a clear resistance zone. For Xiaomi to break out of its current weak sideways pattern, merely reclaiming HKD 30 is insufficient; it must break above and stabilize near HKD 31. If the stock continues to hover between HKD 30 and HKD 30.5 without breaking through HKD 31, the market will likely view any rebound as a weak recovery rather than the start of a new uptrend.
Regarding the Bollinger Bands, the middle band is at HK$30.912, the upper band at HK$32.335, and the lower band at HK$29.489. The current price remains below the middle band but above the lower band, indicating Xiaomi is still in a relatively weak sideways range. This position often frustrates retail investors because the stock isn’t crashing sharply nor showing clear strength—it’s just grinding repeatedly between the lower band and the middle band. If the price later breaks above the middle band at HK$30.912 and further recovers HK$31.162, it could then target a move toward the upper band at HK$32.335. Conversely, if it fails to rise above the middle band, prolonged consolidation near the lows will erode market patience.
The Relative Strength Index (RSI) is around 29.774, indicating weak momentum and proximity to oversold territory. This suggests Xiaomi does have some technical conditions for a short-term bounce, as the price has approached a relatively weak zone and significant additional selling pressure may not emerge immediately. However, a low RSI alone doesn’t confirm a bottom. Currently, Xiaomi remains below key moving averages, and trading volume hasn’t confirmed any reversal. Without a breakout above the HK$30.912–HK$31.162 zone, any low-level rebound could face renewed selling pressure.
In terms of trading volume, yesterday’s turnover was approximately 10.9886 million shares. The rebound occurred on relatively low volume—both the preceding decline and the subsequent bounce saw subdued volume, indicating a low-volume rebound. This is the most significant concern from yesterday. While the price rebounding from HKD 29.860 back above HKD 30 is a positive signal, the lack of accompanying volume suggests that institutional or aggressive buying interest has not yet returned. If the market truly believes HKD 30 is a significant bottom, we should ideally see stronger buying pressure and notably higher volume. Currently, it’s only a low-volume rebound—indicating some support exists at these lows, but not enough momentum to push the price decisively above HKD 31.
Common questions in comments generally fall into three categories. First, whether HKD 30 marks a confirmed bottom. From a technical perspective, there is indeed support near HKD 30, but a confirmed bottom cannot yet be declared because the price has not broken above the HKD 30.912–31.162 zone. Second, whether one should wait for even lower levels, such as HKD 28, HKD 25, or lower. Technically, only if HKD 29.489 is breached would the next support be considered at HKD 28.800; targets like HKD 25, HKD 20, HKD 10, or HKD 9 should not be treated as near-term objectives based on current technical data. Third, whether product launches, new vehicles, or other thematic catalysts can drive the stock price. At this stage, the market is reacting coolly to such news—the real game-changer for the short-term structure isn’t the news itself, but whether the stock can break above HKD 31 on significantly higher volume.
Bulls currently have their strongest argument in the fact that the HK$30 level has held multiple times, and bears have failed to decisively break below it—indicating underlying support at lower levels. Bears, meanwhile, point to Xiaomi still trading below key moving averages, weak volume, lackluster rebounds, and its failure to meaningfully participate even when broader tech or AI-related stocks are rallying strongly. Neutral observers should simplify their approach: the HK$29.860–HK$29.489 zone is the key defensive area, while HK$30.912–HK$31.162 represents the zone for potential strength. Avoid excessive pessimism as long as support holds; equally, avoid undue optimism until the key resistance zone is convincingly breached.
In the short term, Xiaomi offers a slightly below-average risk-reward profile. If the price holds within the HK$29.860–HK$29.489 support zone, it may sustain a low-level rebound and test the HK$30.912–HK$31.162 resistance again. Only a volume-backed breakout above this zone would provide initial signs of technical recovery, opening the path toward the upper Bollinger Band near HK$32.335. Conversely, a break below HK$29.489 would extend the downtrend, with the next support around HK$28.800. For retail investors, the biggest mistake right now would be chasing entries or exits near HK$30 driven by emotional swings. The most actionable opportunities will come either after a confirmed breakout above HK$31 with strong support, or after a breakdown below HK$29.489 prompting a reassessment of downside risk.
Overall, Xiaomi holding near HKD 30 is not a sign of strength. The stock remains below key moving averages, trades below the middle Bollinger Band, and has yet to show a meaningful increase in volume. The market’s biggest frustration is that while HKD 30 appears supported, the price can’t break above HKD 31. As long as this pattern persists, Xiaomi will likely remain in a weak sideways consolidation. Investors should rely on price action and volume—not product launches, new vehicle announcements, or sentiment alone—to guide their entries.

Key levels: In the short term, hold above the range of HK$29.860 to HK$29.489; if this support holds, wait for a rebound and recovery. A breakout above HK$30.912 to HK$31.162 would set the condition to test the next resistance at HK$32.335. If the price breaks below HK$29.489, weakness will likely continue, with the next support around HK$28.800.
Strategy 1 | Hold above HK$29.860–HK$29.489 and position for a rebound and recovery
$UBXIAMI@EC2612A.C (13135.HK)$ | Strike price HK$37.15 | Effective leverage 5.5x | The strike price is not overly aggressive relative to the current share price, making it suitable for recovery positioning after the stock reclaims HK$30.912–HK$31.162, offering a balanced mix of flexibility and downside protection.
$CTXIAMI@EC2612A.C (13147.HK)$ | Strike price HK$37.15 | Effective leverage 5.7x | Slightly higher leverage, ideal for chasing a short-term rebound after the stock breaks above HK$31.162. If the upward move is supported by trading volume, the response will be more immediate.
$BPXIAMI@EC2612A.C (13204.HK)$ | Strike price HK$37.15 | Effective leverage 5.4x | Better suited as a stable choice in the early phase of a rebound, ideal when the stock confirms support above HK$30 and gradually challenges HK$32.335.
Strategy 2 | Turn bearish if price breaks below HK$29.489, targeting HK$28.800 initially
$UBXIAMI@EP2606C.P (23000.HK)$ | Strike price HK$32.16 | Effective leverage 7.2x | Strike price close to current levels, suitable for capturing continued short-term downside after a break below HK$29.489. Offers high sensitivity but should only be deployed once the breakdown level is decisively breached.
$BPXIAMI@EP2606B.P (22664.HK)$ | Strike price HK$32.16 | Effective leverage 8.1x | Higher leverage, suitable for accelerating downside moves toward HK$28.800 after key support is lost—geared toward aggressive short-term bearish positioning.
$GJXIAMI@EP2606B.P (22433.HK)$ | Strike price HK$32.16 | Effective leverage 8.4x | Highest sensitivity among the three options, best used to chase accelerated weakness after confirmation of a breakdown. Not suitable for premature deployment while the stock still holds above HK$29.489.
Strategy 3 | If rebound stalls between HK$30.912 and HK$31.162, position for potential weakness from elevated levels
$UBXIAMI@EP2606B.P (15849.HK)$ | Strike price HK$38.58 | Effective leverage 3.5x | Lower leverage, suitable for a relatively conservative bearish position when the stock price rebounds toward short-term moving averages but fails to break through, appropriate for investors with higher volatility tolerance.
$BIXIAMI@EP2606C.P (22168.HK)$ | Strike price HK$32.18 | Effective leverage 7.0x | Better suited for capturing a pullback after a failed rebound; strike price is close to just above the current spot price, allowing quicker reaction to short-term weakening.
$MBXIAMI@EP2606A.P (23266.HK)$ | Strike price HK$31.888 | Effective leverage 7.9x | Strike price is even closer to the HK$30–HK$32 range, suitable for capturing a short-term pullback after the stock shows clear resistance near HK$30.912–HK$31.162.
Investor Comment Replies
@16685980: The HK$30 level has indeed provided support multiple times, but to confirm a bullish reversal, the price must break above HK$30.912–HK$31.162.
@521721800: If institutional investors begin accumulating positions, we should subsequently see increased trading volume and the stock price breaking above the HK$31 level.
@多啦股神夢: HK$9 represents an extreme target; current technical data does not support such a short-term outlook.
@Donk123: HK$25 is a deeper downside target; technically, the immediate support level to watch is HK$28.800.
Reminder: This article does not constitute any investment advice.
This article is for reference only and does not constitute any investment advice. Market data, opinions, and analysis contained herein may change at any time without prior notice. We are not responsible for any loss or damage caused by reliance on the information in this article. Technical analysis only shows whether certain technical conditions are met; asset performance should be comprehensively evaluated using other sources of information, and trading decisions should not be made solely based on this article. Please note that past performance is not indicative of future results.
#HongKongStocks #RealTimeAnalysis #WarrantPicks #WarrantStrategies #DerivativesHedging #HKWarrantsJenny #HangSengIndex #HangSengTechIndex #BlueChipStocks #TechnicalAnalysis
Feel free to share your insights in the comment section. For more market analysis, please continue following ‘Hong Kong Stock Warrants Jenny’ for daily updates!
Reminder: This article does not constitute any investment advice.
This article is for reference only and does not constitute any investment advice. Market data, opinions, and analysis contained herein may change at any time without prior notice. We are not responsible for any loss or damage caused by reliance on the information in this article. Technical analysis only shows whether certain technical conditions are met; asset performance should be comprehensively evaluated using other sources of information, and trading decisions should not be made solely based on this article. Please note that past performance is not indicative of future results.
#Hong Kong Stocks #Real-time Analysis #Warrants Selection #Warrants Strategy #Derivatives Hedging #Hong Kong Stocks Warrants Jenny #Xiaomi #01810 #Blue Chip Stocks #Technical Analysis $Hang Seng Index (800000.HK)$$Hang Seng TECH Index (800700.HK)$
Risk Disclaimer: The above content only represents the author's view. It does not represent any position or investment advice of Futu. Futu makes no representation or warranty.Read more

Comments
to post a comment
1