
As geopolitical risk premiums fade and Waller turns hawkish, when will precious metals hit bottom?

Zijin Mining broke below the lower Bollinger Band on high volume, weakening its technical structure; support at RMB 32 is now under test
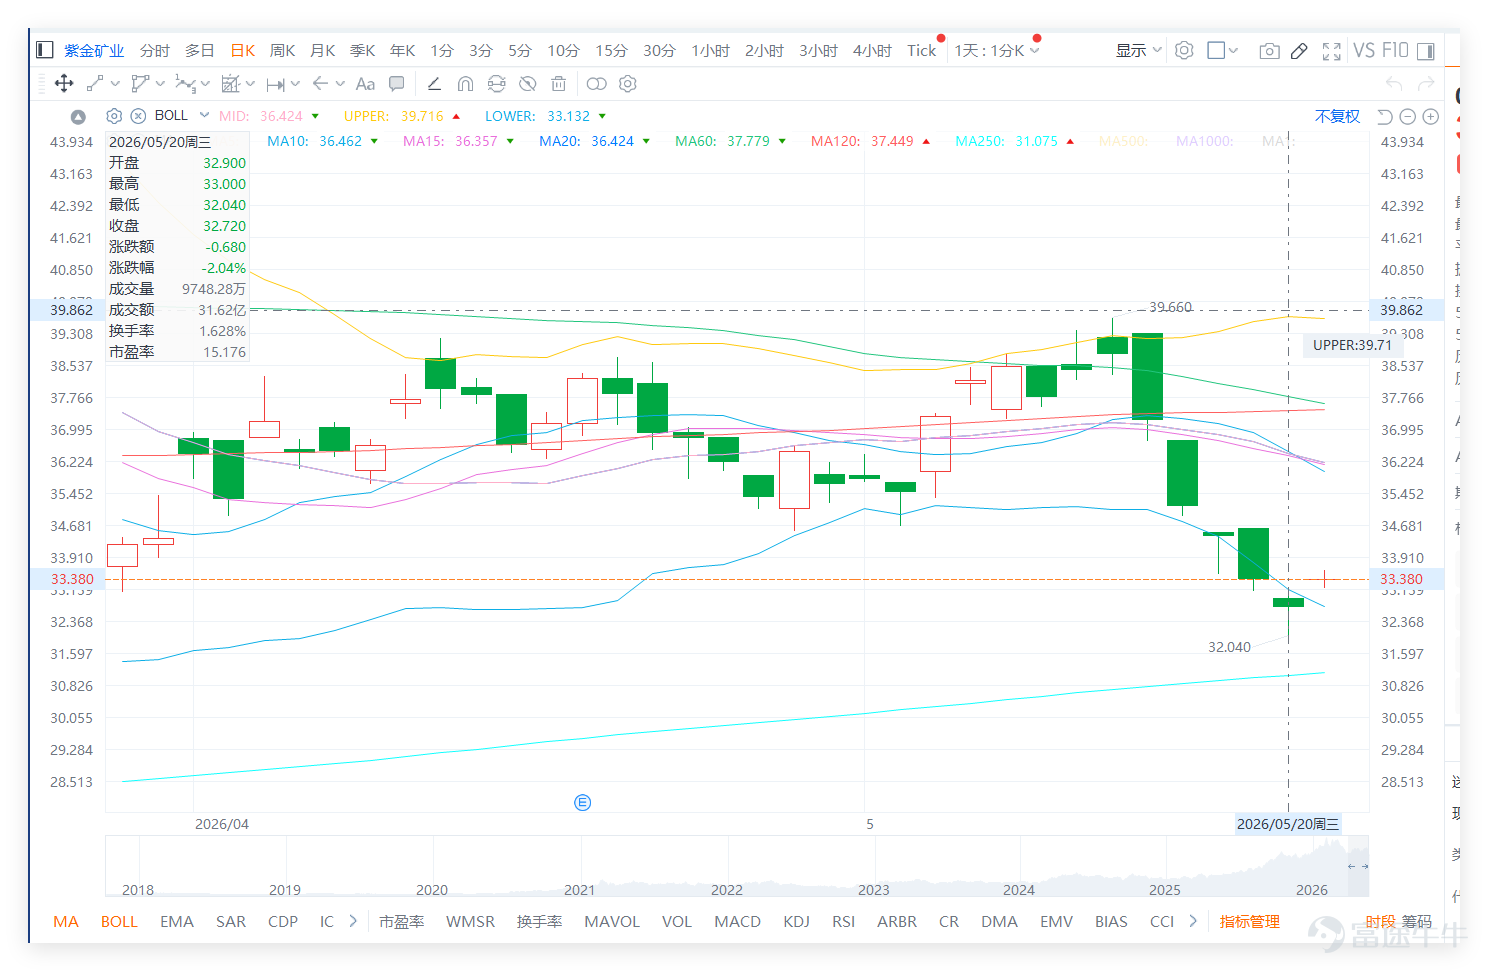
$ZIJIN MINING (02899.HK)$ It closed at RMB32.720 yesterday (the 20th), down RMB0.680 or 2.04%. The share price opened lower and continued to decline throughout the day, reaching an intraday high of only RMB33.000 and a low of RMB32.040. The closing price neared the recent short-term low, indicating that selling pressure has not yet clearly subsided. More importantly, yesterday's closing price of RMB32.720 fell below the 10-day moving average (MA) at RMB36.462, the 20-day MA at RMB36.424, and the 30-day MA at RMB36.688, signaling a clear weakening in the short-term moving average structure. For short-term traders, this is not merely a routine pullback; rather, the stock has already dropped away from key moving averages and broken below the lower Bollinger Band, extending its bearish momentum.

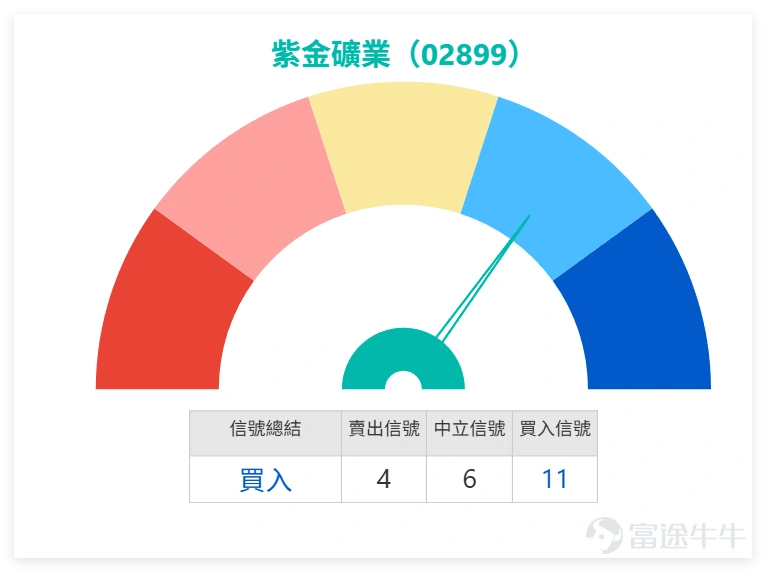
Zijin Mining’s technical signal is 'Buy' (oversold rebound). Compared with peers, $ZHAOJIN MINING (01818.HK)$ closed at HK$22.08 (RSI around 23, technical buy), $SD GOLD (01787.HK)$ closed at HK$25.0 (RSI around 27, strong technical buy), $JIANGXI COPPER (00358.HK)$ closed at HK$35.98 (RSI around 39, technical buy). This indicates that theresourcessector as a whole is in a 'deeply oversold' state. Although Zijin Mining meets conditions for a rebound, it remains constrained by the lack of trend reversal in the gold and copper sectors, making it difficult for the stock to reverse its downtrend independently in the short term.
Comment sentiment is clearly leaning toward nervousness and pessimism. Bullish voices still exist, primarily centered around several arguments: some believe large institutional funds are entering the market, others think prices are being deliberately suppressed to accumulate shares gradually, some feel the stock has fallen enough and is now suitable for bargain hunting, and yet others cite strong earnings, profitability, and main-force fund inflows as reasons to remain optimistic. Such comments reflect that some investors still trust Zijin Mining’s fundamentals and earnings power, believing the sharp short-term price drop does not necessarily indicate deteriorating company value, but rather an overreaction by market sentiment.
However, from a technical structure perspective, these bullish arguments have so far failed to translate into price support. Despite earnings expectations, Zijin Mining’s share price remains under persistent pressure and has broken below the lower Bollinger Band at RMB33.132. This suggests the market is currently pricing in short-term capital outflows and technical breakdowns—not the earnings story. A common mistake retail investors make is assuming the stock has hit bottom simply because the Relative Strength Index (RSI) has fallen to a low level. Zijin Mining’s current RSI of approximately 19.448 is indeed in a clearly weak zone, implying technical rebound potential; however, being oversold does not guarantee an immediate bounce—especially when accompanied by rising volume on declines, suggesting selling pressure may not yet be fully exhausted.
Bearish sentiment in comments is notably stronger. Some investors pointed out the stock has been falling steadily for several days, while others described it as having declined for eight consecutive sessions, believing it remains in a phase of gradual decline and may need to break below RMB30 before they consider re-entering. There were also comments noting large sell orders at RMB32.4, reflecting market attention to whether short-term selling pressure is concentrated in the RMB32–RMB33 range. These observations closely align with the technical trend, as the stock hit a low of RMB32.040 yesterday, very close to the RMB32 mark. If this level breaks, the market will naturally shift its next target downward to RMB31.660, or even the psychological threshold of RMB30.
Market sentiment toward gold and gold mining stocks is also shifting. Some comments noted that war does not guarantee higher gold prices, while others advised staying away from gold miners, warning against assuming they’re a bargain simply because they’ve declined. Such sentiment reflects retail investors’ growing doubts about the traditional safe-haven narrative. When a gold mining stock continues to fall despite seemingly favorable macro conditions, investors begin questioning whether capital has already exited the sector. This shift in sentiment is negative for short-term price action, as it makes bargain hunters more cautious and weakens rebound support.
Observational comments mainly revolve around questions like 'Can we bottom-fish now?', 'Why has it dropped so much?', 'Should we watch neckline support?', and 'Is it okay to buy?'. This precisely captures Zijin Mining’s current critical market state: everyone acknowledges the sharp decline and recognizes that the Relative Strength Index (RSI) is already very low, yet no one can confirm whether selling pressure has ended. For retail investors, the biggest temptation is believing a rebound must follow such a prolonged drop; the greatest risk is that if support levels break, the downtrend could accelerate further.
Technically, the most critical zone for Zijin Mining now is between RMB32.620 and RMB32.040. RMB32.620 serves as near-term support, while RMB32.040 marks yesterday’s low. Only if prices hold above this range can a technical rebound emerge, initially aiming to reclaim the lower Bollinger Band at RMB33.132. Since the current price has already breached the lower band, a move back above RMB33.132 would constitute the first sign of technical recovery. Failure to even regain RMB33.132 would indicate the stock remains trapped below the weak zone, lacking sufficient rebound strength.
The true level that would signal renewed strength lies near HK$34.900. This is a near-term pivot point and a crucial resistance for the stock to escape its current weakness. If Zijin Mining first stabilizes around HK$32 and then climbs back above HK$33.132, the next key test will be whether it can break through HK$34.900. Only a move above HK$34.900 would lead the market to believe the current downtrend might be pausing. Otherwise, even if the stock bounces from current lows, it may merely represent an oversold technical rebound rather than the start of a new uptrend.
Stronger resistance lies around HK$36.424 and HK$36.462, near the 20-day and 10-day moving averages, respectively. These levels remain significantly above the current price and shouldn’t yet be considered near-term targets. Zijin Mining must first address whether it can stabilize after breaking below the lower Bollinger Band—not immediately aim to return above HK$36. If the stock fails to reclaim HK$33.132, discussing a rebound toward HK$36 or higher would be premature.
In terms of trading volume, yesterday’s turnover was approximately 97.483 million shares, with a notable increase in down-volume and a clear expansion compared to the previous few days, indicating that the decline was supported by active selling—a bearish signal from yesterday. If the stock price had merely declined on low volume, the market could interpret this as limited selling pressure; however, the high-volume decline suggests that capital is still exiting at lower levels, implying that selling pressure may not yet be fully exhausted. For a more reliable rebound to occur, it would be preferable to see reduced volume, the share price stabilizing without making new lows, or a recovery above HK$33.132. Should volume continue to expand while the price breaks below HK$32.040, the likelihood of a continued downtrend will increase.
The Relative Strength Index (RSI) stands at approximately 19.448, deep in oversold territory, which technically suggests conditions for a short-term bounce. However, this signal must be interpreted cautiously. A low RSI indicates the stock has fallen sharply and deeply—it does not mean it’s immediately safe to buy. Especially since Zijin Mining is currently trading below all key short-term moving averages and has broken below the lower Bollinger Band, unless it recovers above HK$33.132, oversold conditions can become even more extreme. For short-term traders, this is not a position for blind bottom-fishing but rather one to wait for clear signs of stabilization.
Combining comment sentiment with technical indicators, Zijin Mining currently offers low reward-to-risk potential. Bulls still cite fundamentals, capital flows, bargain-hunting opportunities, and potential accumulation at lower prices—but the market has not yet confirmed these views through price action. Bears, meanwhile, control the short-term rhythm: the stock has broken below the lower Bollinger Band, and volume confirms the selling pressure, making it natural for sentiment to lean bearish. Observers should focus not on how much the stock has already fallen, but on whether HK$32.040 will hold.
In terms of short-term strategy, if Zijin Mining can hold the HK$32.620–HK$32.040 range and reclaim HK$33.132, it will have a preliminary chance of technical repair, with initial upside targeting HK$34.900. A further breakout above HK$34.900 would significantly improve rebound confidence. Conversely, if the price breaks below HK$32.040, weakness will likely persist, with the next support level near HK$31.660; if even that level fails, market discussion around the psychological HK$30 mark will intensify.
Overall, Zijin Mining currently isn't lacking conditions for a rebound—it's just that confirmation of a rebound hasn't emerged yet. The Relative Strength Index (RSI) is already low, and the share price is near short-term lows. However, declining prices on rising volume, a break below the lower Bollinger Band, and trading below key moving averages all indicate that short-term risks remain elevated. For retail investors, the most reasonable approach is to first watch whether the price holds above RMB 32.040, and then see if it can climb back above RMB 33.132. Until both signals appear, the risk-reward ratio for bottom-fishing remains unattractive.
Latest Update (Morning of May 21):
Zijin Mining is currently trading at HK$33.34, up slightly by about 1.89%, halting its recent decline and attempting to fill the gap. It is now testing support near HK$33.13, but whether it can hold steady will depend on accompanying trading volume.
Reply to some investors' views:
@没想好名: Wait for signs of stabilization before buying on dips. For now, monitor whether HK$32.040 holds; avoid rushing in until support is confirmed.
@紫在阿里爆升: It’s too early to say—it depends on whether the share price can reclaim levels above HK$33.132. Otherwise, it remains in a weak zone.
@232466162: Strong earnings do not guarantee an immediate price rebound; the market is currently more focused on short-term selling pressure and technical breakdowns.
Based on the above analysis, the strategies for deployment can be divided into the following main approaches:
Key focus: In the short term, watch whether the HK$32.620–HK$32.040 range holds. Only if support holds firm and the price rebounds above HK$33.132 can a preliminary recovery be expected. If it breaks below HK$32.040, the downtrend is likely to persist, with the next support level around HK$31.660.
Strategy 1 | Break below HK$32.040—go short accordingly
$UBZIJIN@EP2607A.P (25237.HK)$ | Strike price: HK$28.97 | Effective leverage: 7.5x | Strike price close to the lower support zone; suitable for betting on continued weakness after a confirmed break below HK$32.040. Offers higher elasticity but should only be used after confirmation of the breakdown.
$MSZIJIN@EP2607A.P (25188.HK)$ | Strike price: HK$28.97 | Effective leverage: 7.6x | Also tied to a HK$28.97 strike price, with slightly higher leverage; suitable when bearish momentum is clearly established for chasing further downside moves. Not appropriate for premature positioning while support remains intact.
$BIZIJIN@EP2607A.P (24709.HK)$ | Strike price: HK$28.99 | Effective leverage: 6.0x | Lower leverage makes this suitable for those wanting exposure to continued downside without taking the most aggressive short position. Focus on whether the price can move toward HK$31.660 following a confirmed break below HK$32.040.
For more market analysis, stay tuned to Jenny's daily updates on 'Hong Kong Stock Warrants'!
Reminder: This article does not constitute any investment advice.
This article is for reference only and does not constitute any investment advice. Market data, opinions, and analysis contained herein may change at any time without prior notice. We are not responsible for any loss or damage caused by reliance on the information in this article. Technical analysis only shows whether certain technical conditions are met; asset performance should be comprehensively evaluated using other sources of information, and trading decisions should not be made solely based on this article. Please note that past performance is not indicative of future results.
#HKStocks #ZijinMining #Real-TimeAnalysis #WarrantPick #WarrantGuide #DerivativesHedging #HKWarrantsJenny #Blue-ChipStocks #TechnicalAnalysis
Risk Disclaimer: The above content only represents the author's view. It does not represent any position or investment advice of Futu. Futu makes no representation or warranty.Read more
Comment (1)
to post a comment