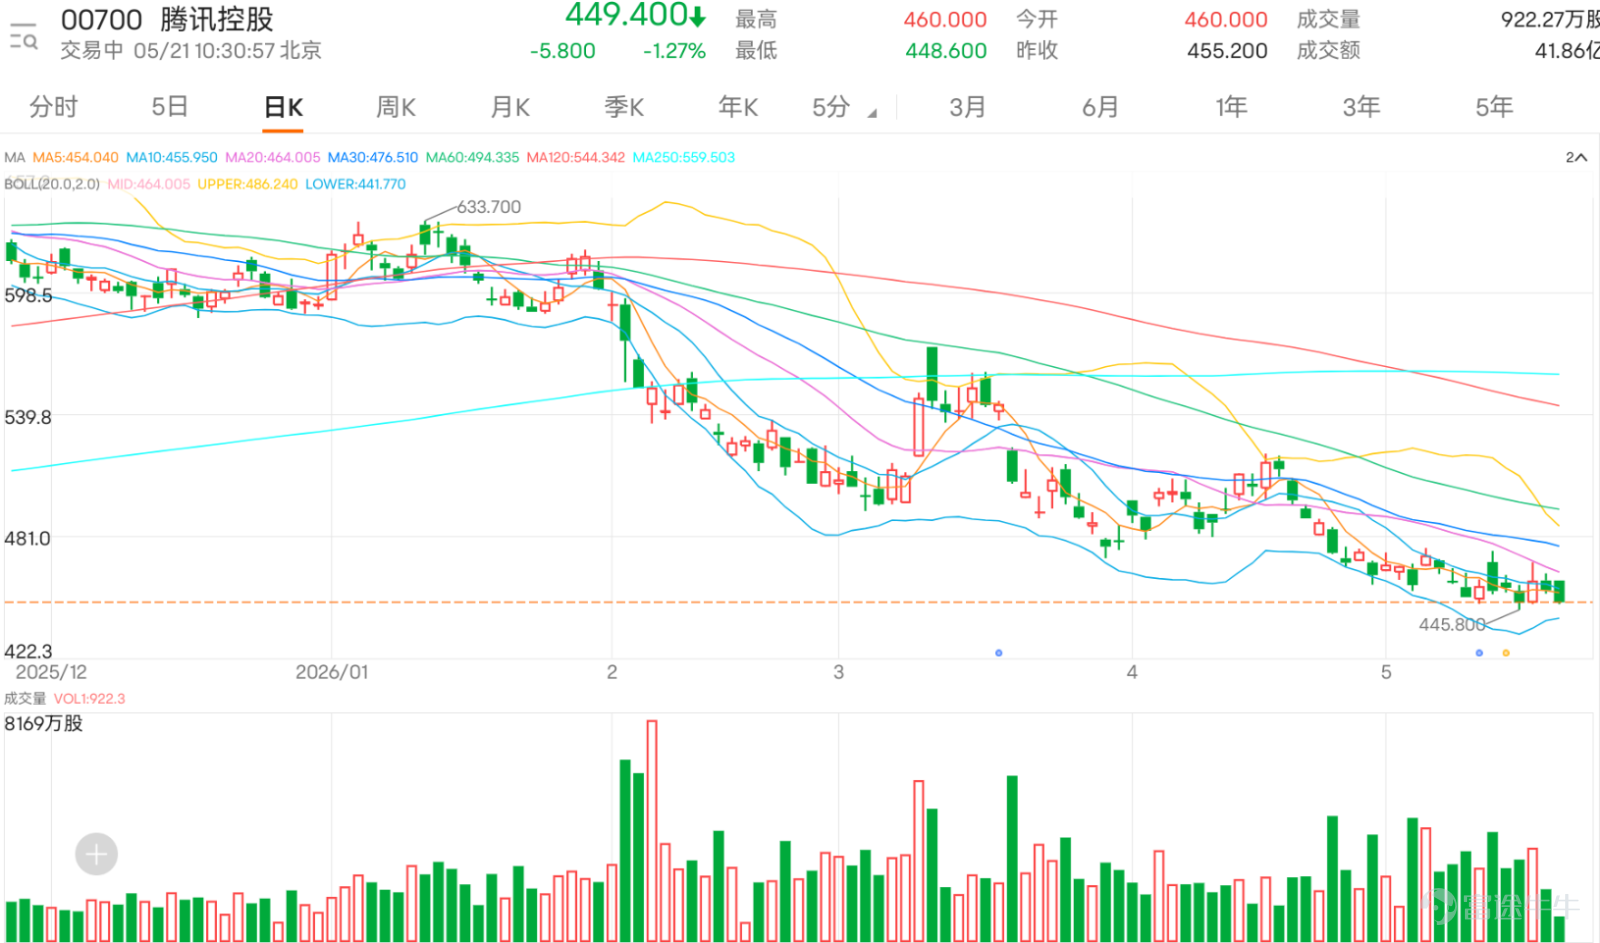
Tencent's short-term rebound lacks momentum; the support zone at HK$440–445 is being tested again
$TENCENT (00700.HK)$ Latest price: HK$449.2. The share price remains below the 10-day moving average (MA) of HK$458.220, the 20-day MA of HK$466.470, and the 30-day MA of HK$478.287, indicating a still weak short-term moving average structure. For retail investors, the key question is whether the price can break back above HK$458.220 and further challenge HK$466.470. Otherwise, any rebound risks being just a brief recovery within a broader weak consolidation phase.
Comment sentiment clearly reflects that Tencent is currently in a state of weakened confidence but has not yet been entirely abandoned. Bullish views mainly focus on share buybacks, valuation, holding above HK$455, waiting for a rebound, and hoping the company can stabilize its share price through its own strength. Some investors mentioned buybacks, expressing hope that Tencent will use them to deter short sellers—indicating that market expectations for Tencent have lowered. In the past, as a core heavyweight stock in the Hong Kong market, investors often expected Tencent to lead the broader market upward. However, comments now include statements like 'It can only rely on itself—the index won’t help,' reflecting that retail investors no longer expect the broader market to lift Tencent; instead, they simply hope Tencent can first stabilize on its own.
However, even among bullish comments, there’s a strong sense of resignation. Some investors say they still believe in the company’s intrinsic value, while others regret not selling one lot earlier in the day. There are even questions about whether the stock will only rise after southbound capital finishes unwinding positions. These comments indicate that long-term conviction remains, but short-term patience is wearing thin. It’s not that Tencent lacks fundamental trust—it’s that the stock’s recent pattern of repeated weakness has made it hard for holders to endure the daily cycle of opening higher only to close lower, with rallies consistently getting rejected.
Bearish and disappointed comments better reflect the dominant short-term sentiment. Many investors describe the stock price as 'climbing all morning only to drop sharply in one go,' 'rallying then fading repeatedly,' or 'pulled up only to be knocked back down again.' These remarks closely match today’s technical price action. Tencent has recently failed to hold intraday gains, indicating persistent selling pressure overhead. Even without sharp declines, each failed rebound reinforces negative market psychology, making investors hesitant to chase the stock and prompting short-term traders to sell into any rallies.
Many comments also mention share buybacks. Some argue that yesterday’s trading volume was only half of normal, with buybacks accounting for a significant portion—making it easy for shorts to push the price down and equally easy for buybacks to lift it back up. Others question whether the stock would fall if no buybacks occurred. This shows the market now views buybacks as a critical short-term support factor for Tencent. However, this raises another concern: if the stock price relies on buybacks merely to hold steady, the market naturally worries about insufficient genuine buying interest. While buybacks can provide floor support, without follow-through from external capital, the share price may remain range-bound below key moving averages.
Onlookers are primarily focused on several key questions: Can HK$455 hold as support? Is there one final drop left? Are HK$400 or HK$420 the real entry points? These questions show the market isn’t rushing to confirm a turnaround in Tencent’s strength; instead, investors are first watching whether the stock will decline further. Tencent’s current price is very close to its short-term support zone—if this area fails to hold, short-term weakness will likely persist, with the next support level seen around HK$445.800 to HK$440.621.
Technically, RMB 453.600 is currently the most immediate support level. If Tencent can hold above RMB 453.600 in the short term and break back above the 10-day moving average at RMB 458.220, it will have初步 conditions for a technical recovery. This is also the most critical turning point in today’s analysis. Since RMB 458.220 represents both the 10-day moving average and the first key hurdle for any short-term rebound to escape downward pressure, failure to reclaim this level would keep the stock confined within a weak trading range.
The next resistance level higher up is HK$466.470, which coincides with the Bollinger Band midline and the 20-day moving average. Tencent’s current price remains below this midline, confirming it has not yet emerged from its weak posture. Should the stock manage to break above HK$458.220, the next test will be whether it can reclaim HK$466.470. Only by decisively moving back above HK$466.470 would the market begin to believe Tencent’s short-term structure is showing meaningful recovery. The 30-day moving average at HK$478.287 remains significantly higher; until the prior two resistance levels are cleared, it’s premature to look that far ahead.
Regarding the Bollinger Bands, the midline sits at HK$466.470, with the upper band at HK$492.319 and the lower band at HK$440.621. Tencent’s current price of HK$455.200 remains below the midline, yet not too far from the lower band, placing it in a relatively weak zone. If HK$453.600 breaks down, the next major support zone would be between HK$445.800 and HK$440.621. This explains why many comments are now referencing much lower potential entry points like HK$420 or HK$400—the market focus is shifting from expecting rebounds to prioritizing defense.
The Relative Strength Index (RSI) stands at approximately 43.224, indicating slight improvement in momentum, though it has not yet returned to strong territory. This suggests Tencent is neither extremely oversold nor clearly strong, but rather in a state of weak rebound from lower levels. Such a position is particularly prone to disappointment, as it lacks both the elasticity of a sharp bounce following a steep decline and the trend confirmation of breaking above key moving averages. For the stock to shift market sentiment, it must break above RMB 458.220 with accompanying improvement in trading volume.
In terms of trading volume, yesterday’s turnover was around 18.9276 million shares. The rebound occurred without a noticeable increase in volume—indeed, recent declines and rebounds have both seen relatively low volume, indicating a low-volume rebound. This is one of the biggest concerns today. A price rebound without sufficient volume suggests that capital is not actively stepping in. If the stock fails to break above RMB 458.220 on increased volume in the short term, the rebound could easily face renewed selling pressure. This aligns with comments describing patterns like 'rally-and-dump,' 'whack-a-mole,' or 'endless selling pressure'—as without volume support, even minor selling can quickly push prices back down.
Combining comment sentiment with technical price action, Tencent’s current risk-reward profile is neutral-to-bearish. Bulls cite buybacks, intrinsic value, and the defensive strength of a large-cap platform company, yet short-term technicals haven’t confirmed a turnaround. Bears, meanwhile, highlight the stock trading below key moving averages, low-volume rebounds, and repeated failures to sustain rallies—all signs pointing to lingering downside risk. For those on the sidelines, the key levels to watch aren’t HK$400 or HK$480, but rather HK$453.600 and HK$458.220: the former is the defensive line, the latter the repair line.
From a short-term tactical perspective, only if Tencent holds above HK$453.600 and reclaims HK$458.220 will it establish preliminary conditions for recovery, with subsequent targets at HK$466.470 and HK$478.287. Conversely, if the price breaks below HK$453.600, weakness will likely extend, with the next support zone near HK$445.800 to HK$440.621. For retail investors, the biggest mistake right now would be chasing the stock after just one day of rebound, as the price remains below key moving averages. Equally unwise is aggressively shorting before a confirmed breakdown below HK$453.600, as buybacks and defensive support could still emerge near these lows.
Overall, Tencent’s inability to break above RMB 458.220, coupled with unexpanded trading volume, indicates that the current rebound lacks convincing strength. The truest reflection of market sentiment is that many still believe Tencent is a fundamentally sound company, yet doubt its share price can rise easily in the near term. To reverse this perception, the first step isn’t about discussing intrinsic value—it’s about reclaiming RMB 458.220 and then targeting RMB 466.470. Until that happens, Tencent remains in a phase of weak consolidation, not a strong counterattack.
Key tactical levels: In the short term, defend RMB 453.600—if held firmly, wait for a potential rebound and recovery. A breakout above RMB 458.220 would open the path toward testing RMB 466.470 and RMB 478.287. Conversely, if the price breaks below RMB 453.600, weakness will likely persist, with the next support zone seen near RMB 445.800 to RMB 440.621.

Strategy One | Play for a rebound after holding above RMB 453.600
$UBTENCT@EC2706A.C (27993.HK)$ | Strike Price: RMB 500.5 | Effective Leverage: 4.7x | With a strike price close to the RMB 500 psychological level, this option is suitable for deploying after the stock reclaims RMB 458.220, offering moderate elasticity and serving well as a core choice in the early stage of a rebound.
$HSTENCT@EC2706A.C (28585.HK)$ | Strike Price: RMB 500.5 | Effective Leverage: 4.8x | Slightly higher leverage, ideal for chasing short-term upside elasticity after the stock breaks above RMB 458.220. If accompanied by improved volume, the response will be more direct.
$CITENCT@EC2706A.C (27367.HK)$ | Strike Price: RMB 500 | Effective Leverage: 4.6x | The strike price is not overly aggressive relative to upside targets, making it suitable for a more conservative rebound strategy as the stock gradually challenges RMB 466.470.
Strategy Two | Turn bearish if the price breaks below RMB 453.600
$UBTENCT@EP2608A.P (26333.HK)$ | Strike price: HK$466.46 | Effective leverage: 8.7x | Strike price is slightly above the current spot price, suitable for capturing accelerated short-term downside after the stock breaks below HK$453.600. Offers higher sensitivity but requires strict confirmation of support breakdown before deployment.
$BPTENCT@EP2608A.P (26244.HK)$ | Strike price: HK$466.46 | Effective leverage: 9.1x | Higher leverage, suitable for targeting a move toward HK$445.800–HK$440.621 after breaking below HK$453.600, favoring an aggressive short-term trading approach.
$MSTENCT@EP2608B.P (26484.HK)$ | Strike price: HK$466.46 | Effective leverage: 8.9x | Suitable for chasing continued weakness after confirming a breakdown below support. Reacts quickly and works best when the stock re-breaks intraday lows on the downside.
Strategy Three | Price rebounded to around HK$466.470 but faced resistance, favoring a short setup as momentum turns weak at elevated levels.
$UBTENCT@EP2612A.P (14201.HK)$ | Strike price: HK$481.61 | Effective leverage: 4.7x | Higher strike price offers stronger defensive positioning than Strategy Two, suitable for capturing a pullback after a rebound to around HK$466.470 fails to break higher.
$GJTENCT@EP2612A.P (18124.HK)$ | Strike price: HK$481.61 | Effective leverage: 5.2x | Higher leverage, suitable when the stock weakens after encountering resistance near HK$466, favoring a short-term move back toward HK$453.600 or even HK$445.800.
$CTTENCT@EP2612A.P (14210.HK)$ | Strike price: HK$481.61 | Effective leverage: 5.1x | Positioned between defensive and responsive strategies, suitable for deploying short positions when a rebound shows weakness and volume fails to expand.
Investor Comment Replies
@天天都開心: Buybacks may provide support, but the stock still needs to rise above HK$458.220 to initially break bearish pressure.
@順勢而為: To drop to HK$400, the stock must first break below HK$453.600, then lose HK$445.800–HK$440.621. This scenario has not yet unfolded.
@開心正能量: Reaching HK$420 requires first breaking below HK$440.621—this technical level has not yet been reached.
@ChitogeThe downside room may be limited, depending on whether the lower Bollinger Band at HK$440.621 can hold; a bottom has not yet been confirmed.
Reminder: This article does not constitute any investment advice.
This article is for reference only and does not constitute any investment advice. Market data, opinions, and analysis contained herein may change at any time without prior notice. We are not responsible for any loss or damage caused by reliance on the information in this article. Technical analysis only shows whether certain technical conditions are met; asset performance should be comprehensively evaluated using other sources of information, and trading decisions should not be made solely based on this article. Please note that past performance is not indicative of future results.
#HongKongStocks #RealTimeAnalysis #WarrantPicks #WarrantStrategies #DerivativesHedging #HKWarrantsJenny #HangSengIndex #HangSengTechIndex #BlueChipStocks #TechnicalAnalysis
Feel free to share your insights in the comment section. For more market analysis, please continue following ‘Hong Kong Stock Warrants Jenny’ for daily updates!
Reminder: This article does not constitute any investment advice.
This article is for reference only and does not constitute any investment advice. Market data, opinions, and analysis contained herein may change at any time without prior notice. We are not responsible for any loss or damage caused by reliance on the information in this article. Technical analysis only shows whether certain technical conditions are met; asset performance should be comprehensively evaluated using other sources of information, and trading decisions should not be made solely based on this article. Please note that past performance is not indicative of future results.
#HKStocks #Real-TimeAnalysis #WarrantPick #WarrantGuide #DerivativesHedging #HKWarrantsJenny #Tencent #00700 #Blue-ChipStocks #TechnicalAnalysis
Risk Disclaimer: The above content only represents the author's view. It does not represent any position or investment advice of Futu. Futu makes no representation or warranty.Read more
Comments (5)
to post a comment