
Dividend Income Cheat Sheet: June Dividend Season Is Here—Earn Up to HK$1,596 Per Lot!
Deconstructing the 'High-Yield Trap': A Low-Volatility + High-Dividend Strategy for Dual Income and Capital Preservation
Many investors in the Hong Kong stock market chase high dividends, but when seeing attractive dividend yields of 8% or even over 10%, they must avoid blindly jumping in, lest they fall into the 'earning dividends while losing on price' trap.
 – Seeing through the illusion of the 'high-dividend trap'
 Hypothetical scenario description:
Initial investment: Assume an investor buys a stock at $100 per share.
Expected dividend: The expected dividend yield at the time of purchase is 15%, meaning an expected dividend of $15。
Stock price movement: After purchase, the company's fundamentals deteriorate, and the stock price drops by 50%, resulting in an ending share price of $50。
Actual dividend payout: Assuming the company still pays the dividend as scheduled, amounting to $15 per share.
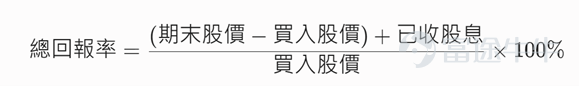
When evaluating the actual performance of this investment, one must consider not only the dividend yield but also calculate thetotal return. The formula is as follows:
![$Fullgoal HangSeng HK High Dividend ETF (03031.HK)$ Many Hong Kong investors chase high yields, but when encountering enticing dividend yields of 8% or even above 10%, they must avoid rushing in blindly—lest they fall into the 'earn dividends, lose on price' trap. [Shocked]– Seeing Through the True Nature of the 'High-Yield Trap' Illustrative Scenario: Initial Investment: Assume an investor buys a stock at $100 per share. Expected Dividend: The expected dividend yield at purchase is 15%, i.e., the expected dividend per share is $15。 Stock price change: The company's fundamentals deteriorated after purchase, causing the stock price to fall 50%, and the ending stock price dropped to $50。 Actual dividend: Assuming the company still pays the scheduled dividend of $15 per share. When evaluating the actual performance of this investment, one must not consider only the dividend yield, but must calculate the total returnincluding capital gains or losses.The formula is as follows: Substituting the numbers from the above hypothetical scenario into the formula: Capital loss (paper loss on share price): $50 - $100 = -$50 Dividend income: +$15 Net total gain/loss: -$50 + $15 = -$35 The result shows that even though the investor received the expected high dividend yield of 15%, the significant drop in share price meant the investment still ended up with a negative total return. -35%。 Note: The figures above are purely hypothetical and used solely for illustrative mathematical purposes to highlight the difference between 'dividend yield' and 'total return,' as well as the associated risks...](https://nnqimage.futunn.com/sns_client_feed/233687841/20260520/web-1779261802672-wuRXihYWnd.png/big?area=2&is_public=true&imageMogr2/ignore-error/1/format/webp)
Plugging the numbers from the above hypothetical scenario into the formula:
Capital gain/loss (paper loss from share price decline): $50 - $100 = -$50
Dividend income: +$15
Net total profit/loss: -$50 + $15 = -$35
The results show that even though investors received the expected high dividend yield of 15%, the substantial drop in share price meant the total return on this investment was still negative. -35%。
Note: The above figures are purely hypothetical, intended solely for illustrative mathematical purposes to highlight the difference and potential risks between 'dividend yield' and 'total return.' They do not reflect the actual performance of any specific stock and do not constitute investment advice.
To avoid falling for disguises, always watch out for these three red flags:」:
」:1. Unsustainable earnings: Profits inflated by one-time, non-recurring gains, with no core profitability.
2. Dividend payout beyond means: Dividend payments exceed what free cash flow can support.
3. Debt-funded dividends: Dividends paid using borrowed money—payouts could be suspended if economic conditions deteriorate.
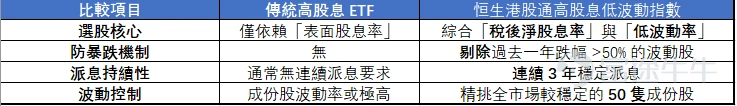
– Solution: 3031 Fullgoal Hang Seng Hong Kong Dividend ETF True dividend investing prioritizes 'asset price stability' above all else.3031 Fullgoal Hang Seng Hong Kong Dividend ETF Tracks the 'Hang Seng Hong Kong Connect High Dividend Low Volatility Index (Net Total Return Version)', avoiding blind pursuit of high yields and employing a 'dual-factor mechanism' to establish two layers of defense:
Source: Official website of HKEX and Fullgoal Asset Management (Hong Kong) Limited
Why does the combination of 'low volatility + high dividend yield' create a synergistic effect?
Historical data demonstrates that the 'low volatility + high dividend yield' strategy generates a powerful synergistic effect. Compared with a pure high-dividend index and the Hang Seng Index (HSI), the index tracked by this fund shows the following results over the period from May 2017 to February 2026:
Double the cumulative return: The cumulative return reached 128%, nearly double that of the pure high-dividend index (65.6%) and significantly outperforming the HSI (48.9%).
Strong downside protection: Lowest potential drawdown (-33.4%) and the lowest overall volatility among the three (18.6%).
High risk-adjusted return: A Sharpe ratio of 0.53, far exceeding that of the pure high-dividend strategy (0.31) and the broader market (0.24), demonstrating superior investment efficiency.
![$Fullgoal HangSeng HK High Dividend ETF (03031.HK)$ Many Hong Kong investors chase high yields, but when encountering enticing dividend yields of 8% or even above 10%, they must avoid rushing in blindly—lest they fall into the 'earn dividends, lose on price' trap. [Shocked]– Seeing Through the True Nature of the 'High-Yield Trap' Illustrative Scenario: Initial Investment: Assume an investor buys a stock at $100 per share. Expected Dividend: The expected dividend yield at purchase is 15%, i.e., the expected dividend per share is $15。 Stock price change: The company's fundamentals deteriorated after purchase, causing the stock price to fall 50%, and the ending stock price dropped to $50。 Actual dividend: Assuming the company still pays the scheduled dividend of $15 per share. When evaluating the actual performance of this investment, one must not consider only the dividend yield, but must calculate the total returnincluding capital gains or losses.The formula is as follows: Substituting the numbers from the above hypothetical scenario into the formula: Capital loss (paper loss on share price): $50 - $100 = -$50 Dividend income: +$15 Net total gain/loss: -$50 + $15 = -$35 The result shows that even though the investor received the expected high dividend yield of 15%, the significant drop in share price meant the investment still ended up with a negative total return. -35%。 Note: The figures above are purely hypothetical and used solely for illustrative mathematical purposes to highlight the difference between 'dividend yield' and 'total return,' as well as the associated risks...](https://nnqimage.futunn.com/sns_client_feed/233687841/20260520/web-1779262359974-9Du7p8Uh94.png/big?area=2&is_public=true&imageMogr2/ignore-error/1/format/webp)
Note: Data sourced from Wind, covering the period from May 8, 2017, to February 27, 2026. Past index performance does not indicate future results and is not a guarantee of the fund’s future performance. The Hang Seng Hong Kong Connect High Dividend Low Volatility Index (HSHYLV) and its Dividend Accumulation Index (HSHYLVDV) were launched on May 8, 2017, with a base date of September 3, 2010. The total returns for the past five years are as follows: 2021 – 3.39% (11.49% for the dividend accumulation index); 2022 – -13.84% (-7.23%); 2023 – 2.47% (10.14%); 2024 – 22.01% (31.26%); 2025 – 18.97% (27.27%). Price return indices reflect only the price movements of constituent stocks and exclude dividend distributions; dividend accumulation indices incorporate both price changes and dividend income. The Net Dividend Accumulation Index (HSHYLVN) further deducts taxes related to dividends from the dividend accumulation index. Historical index performance does not predict future returns, and historical dividend payments do not guarantee future distributions or fund performance.
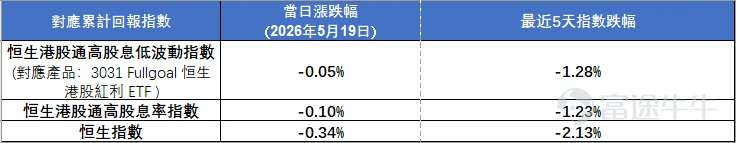
*Data source: Bloomberg, as of May 19, 2026
Helpful Tip: The market is currently paying close attention to dividend distributions from various high-yield products! When monitoring ETF dividend schedules, investors should not only focus on the dividend amount but also understand the following three key dates to accurately track the income receipt process:
– Ex-dividend date: Investors who purchase fund units on or after this date will not be entitled to the current dividend.
– Record date: The fund company finalizes the list of unit holders eligible for the dividend on this date.
– Payment date: The date on which dividends are officially credited to eligible investors’ accounts.
All dividend arrangements (if any) for our firm’s ETF products will strictly comply with regulatory requirements and be announced through official channels. Investors seeking the latest information are advised to closely monitor formal announcements published on HKEX’s “披露易” (HKExnews) platform and our official website.
Thank you for your continued interest in our products!
Summary: Optimize Your Dividend Capture and Idle Cash Allocation Strategy
True passive income aims for both capital preservation and yield. In a declining interest rate environment, high-quality income-generating assets with 'low volatility' and defensive characteristics not only help you avoid pitfalls but also serve as the optimal tool for upgrading cash management and enhancing portfolio yield.
Risk Warning
Disclaimer:
This document is for informational purposes only and does not constitute an offer or solicitation to buy or sell any investment products, nor does it provide any advice or recommendations. The information contained herein does not consider your specific investment objectives, financial situation, or personal needs, and should not be relied upon as a substitute for professional advice. You should seek independent professional advice before making any investment decisions.
Investment involves risks, including possible loss of principal. Past performance is not indicative of future fund returns. The value of fund units can go up or down, and future returns are not guaranteed. Listed classes of funds are traded on exchanges at market prices, which may differ from net asset value. Investors should read the fund's offering documents, including its prospectus and risk factors, prior to investing. Information about the fund in Hong Kong can be found at https://www.fullgoal.com.hk/en (the content of this website has not been reviewed by the SFC).
This material is issued by Fullgoal Asset Management (Hong Kong) Limited and has not been reviewed by the Securities and Futures Commission of Hong Kong. Some information in this document is derived from third-party sources believed to be reliable, but we make no representation or warranty regarding its accuracy, completeness, or timeliness.
This document is issued exclusively for persons within jurisdictions authorized to distribute the fund. It may not be reproduced or copied without prior permission. This communication is not directed at U.S. persons, nor should it be acted upon by U.S. persons.
Index Provider Disclaimer
The index is published by Hang Seng Indexes Company Limited, and Fullgoal Asset Management (Hong Kong) Co., Ltd. has been authorized to use and quote the index for the relevant ETF. Hang Seng Indexes Company Limited expressly disclaims any warranty or responsibility for the accuracy, completeness, merchantability, or fitness for a particular purpose of the index. It also bears no legal liability for any loss arising from the use of the index or related products. For the full version of the index disclaimer, please refer to the relevant fund prospectus.
Risk Disclaimer: The above content only represents the author's view. It does not represent any position or investment advice of Futu. Futu makes no representation or warranty.Read more

Comments (5)
to post a comment
1