Tencent has again lost the HK$460 level; the real test remains at the pivotal resistance around HK$469.
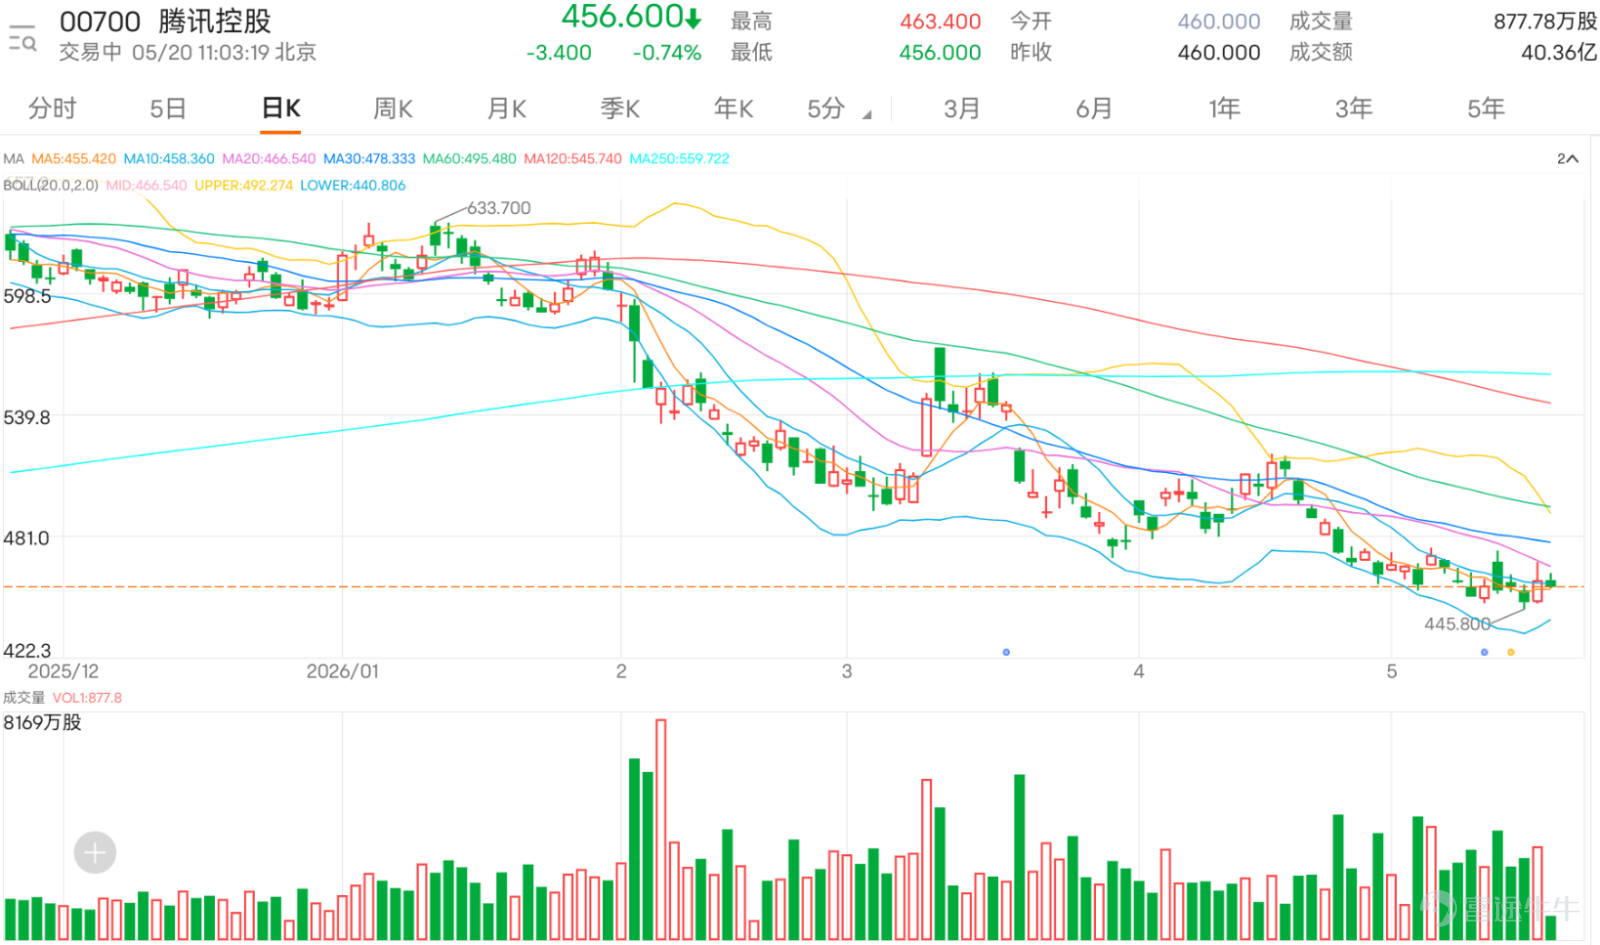
$TENCENT (00700.HK)$ Currently trading at HK$456.6, market sentiment has not yet coalesced into broad bullish consensus, based on technical structure and investor comments. Retail investor sentiment is clearly split: one camp expects Tencent to reclaim HK$470, HK$480, or even HK$500, viewing share buybacks, AI strategies, and positive broker ratings as catalysts for price recovery; the other camp remains concerned this is merely a weak rebound—up one day, down several days—and believes the rally lacks strength until key resistance levels are decisively breached. This sentiment structure indicates Tencent is not in a one-sided strong uptrend but rather in a post-rebound phase awaiting confirmation.
From the key points in investor comments, bullish investors are most focused on whether Tencent can rise back to the HK$470–HK$480 range. Some investors explicitly mentioned targets like closing at HK$470, HK$468, or HK$480, while others set sights even higher—at HK$500, HK$520, or beyond—reflecting sustained market confidence in Tencent, especially among long-term holders willing to wait for price recovery. Many comments also referenced share buybacks, hoping they would boost the share price, with some suggesting that increased buyback intensity could provide meaningful support. Such remarks indicate that, as a major tech stock, retail investors still have faith in Tencent’s fundamentals, though short-term confidence still hinges on actual price performance for confirmation.
However, even among bullish comments, there is considerable anxiety. Some say, 'It never stays green for more than a day—this time, dare it stay green longer?' while others remark, 'Up one day, down three days.' These statements aren’t purely bearish; rather, they reflect investors’ repeated experiences of brief rebounds followed by renewed declines. Thus, even with today’s price gain, many remain skeptical. This captures the core contradiction in Tencent’s current market sentiment: investors still want to believe in a rebound, but past price weakness and volatility have left them doubting every rally.
Technically, Tencent’s current price is slightly below the 10-day moving average of HK$458.470, and also below the 20-day MA at HK$469.395 and the 30-day MA at HK$479.243, indicating major moving averages have not yet been repaired. For short-term traders, the true key level isn’t HK$460, but rather the pivotal zone near HK$469.395.
Regarding Bollinger Bands, the middle band sits at HK$469.395, with the upper band at HK$501.871 and the lower band at HK$436.919. The current price remains below the middle band, confirming the stock is still in a relatively weak zone overall. This aligns closely with market sentiment reflected in investor comments: although investors hope for a close above HK$470, technically the HK$470 area coincides precisely with a key short-term resistance zone. If the price breaks above HK$469.395, the rebound structure would improve significantly, opening the path to challenge HK$479.243 next. However, if the price stalls near HK$469–HK$470, concerns about the 'up one day, down several days' pattern will likely intensify again.
The Relative Strength Index (RSI) is around 49.375, indicating that momentum has recovered somewhat from earlier levels but has not yet entered a clearly bullish zone. This suggests Tencent is not extremely weak at the moment, but a confirmed strengthening trend has not yet emerged. If the RSI aligns with a price breakout above HK$469.395, market confidence in the rebound would increase; conversely, if the share price faces resistance near the 20-day moving average and pulls back, the recent improvement in momentum may only be a temporary correction rather than the start of a new uptrend.
In terms of trading volume, the latest turnover is not particularly notable compared to some prior high-volume days and remains generally moderate and stable. Although the stock price rebounded today, there was no significant surge in volume, indicating the rally currently lacks strong volume support. This is the key point to watch in this rebound. If a stock’s price rises without a corresponding increase in trading volume, it suggests buying interest remains cautious—likely driven by short-term covering or dip-buying rather than strong institutional capital re-entering the market. This also explains why many investors, despite seeing the price recover, still ask whether they should hold overnight or worry the gain will reverse tomorrow.
Bearish comments, though not numerous, focus on insufficient rebound strength and an overall weak technical structure. Some investors believe Tencent remains technically weak, while others note multiple moving averages are still acting as overhead resistance—if these aren’t broken, the stock may continue drifting lower. These views align with technical analysis: although Tencent has recently returned near the 10-day moving average, it has yet to break above the 20-day and 30-day moving averages. A single day’s rebound alone isn’t sufficient to confirm a return to strength. For bears, the zone between HK$469.395 and HK$479.243 is critical for determining whether the rebound fails.
Neutral or观望 (wait-and-see) comments reflect retail investors’ most practical concern: 'It rose today—can I hold overnight?' Many fear gaining HK$15 today only to lose it all tomorrow, showing a lack of confidence in the rally’s sustainability. Others ask about the implications of major institutions offloading shares or whether a sharp drop ('pi'—a slang term for a sudden plunge) is imminent, revealing ongoing attention to capital flows and short-term selling pressure. Such sentiment is common during weak rebounds, as holders tend to sell into rallies if resistance isn’t breached, and bears await higher levels to re-establish short positions.
Therefore, Tencent’s current common questions can be summarized into three points. First, is it advisable to chase the stock now? From a technical perspective, the share price has not yet broken through the key resistance level of HK$469.395, so the risk-reward ratio for chasing remains neutral. If pursuing a breakout strategy, it would be more reasonable to wait for the price to surpass HK$469.395 and confirm sustained strength above that level before targeting HK$479.243. Second, can existing Tencent holders aim for HK$500? The HK$500 level is close to the upper Bollinger Band at HK$501.871, making it a relatively distant upside target. In the near term, the stock must first reclaim HK$469.395 and then HK$479.243; otherwise, discussing a move directly to HK$500 is premature. Third, is it safe to hold call warrants or long positions overnight? If the share price stabilizes above HK$460 and continues to challenge HK$469.395, short-term monitoring remains appropriate. However, if the price breaks below HK$458.470 again and further loses support at HK$448.600, the downtrend will likely persist, significantly increasing overnight holding risk.
Overall, Tencent currently offers a neutral risk-reward profile. The share price has rebounded from recent lows and is now slightly above the 10-day moving average, modestly improving its short-term outlook. However, since the current price remains below both the 20-day and 30-day moving averages and is still under the middle Bollinger Band, the rebound hasn’t been confirmed. Retail comments expressing hopes for HK$470, HK$480, or even HK$500 reflect lingering market confidence, yet widespread remarks like 'up one day, down several,' 'rises today, falls back tomorrow,' or 'never stays green for more than a day' reveal unstable sentiment.
In the near term, Tencent’s key focus is whether it can stabilize around HK$460. If it holds and breaks above HK$469.395, the price could further recover toward HK$479.243, boosting market confidence in levels above HK$470. Only after surpassing HK$479.243 would the rebound realistically target the upper Bollinger Band near HK$501.871. Conversely, if the price drops again below HK$458.470, the brief advantage of reclaiming the 10-day moving average vanishes; a further breakdown below HK$448.600 and HK$445.800 would extend the downtrend. At this stage, excessive optimism based on a single-day rebound is unwarranted, just as blind shorting before key supports are breached is unwise. The true pivotal level to watch is HK$469.395: until it’s decisively broken and held, Tencent’s move remains a weak rebound; only after such a breakout will the short-term risk-reward profile meaningfully improve.
![$TENCENT (00700.HK)$ Currently trading at HK$456.6, market sentiment has not yet coalesced into broad bullish consensus, based on technical structure and investor comments. Retail investor sentiment is clearly split: one camp expects Tencent to reclaim HK$470, HK$480, or even HK$500, viewing share buybacks, AI strategies, and positive broker ratings as catalysts for price recovery; the other camp remains concerned this is merely a weak rebound—up one day, down several days—and believes the rally lacks strength until key resistance levels are decisively breached. This sentiment structure indicates Tencent is not in a one-sided strong uptrend but rather in a post-rebound phase awaiting confirmation. From the key points in investor comments, bullish investors are most focused on whether Tencent can rise back to the HK$470–HK$480 range. Some investors explicitly mentioned targets like closing at HK$470, HK$468, or HK$480, while others set sights even higher—at HK$500, HK$520, or beyond—reflecting sustained market confidence in Tencent, especially among long-term holders willing to wait for price recovery. Many comments also referenced share buybacks, hoping they would boost the share price, with some suggesting that increased buyback intensity could provide meaningful support. Such remarks indicate that, as a major tech stock, retail investors still have faith in Tencent’s fundamentals, though short-term confidence still hinges on actual price performance for confirmation. However, even among bullish comments, there’s considerable anxiety. Some say, 'It never stays red [bullish] for more than a day—will it dare stay red longer this time?' Others remark, 'Up one day, down three days.' These remarks aren’t purely bearish; rather, they reflect investors’ repeated experiences with short-lived...](https://nnqimage.futunn.com/sns_client_feed/1162342/20260520/web-1779246215146-rN3PUiLMuU.png/big?area=1&is_public=true&imageMogr2/ignore-error/1/format/webp)
Trading focus: In the short term, watch whether HK$460 can hold as support. Only if the price stabilizes and breaks above HK$469.395 will conditions for recovery be in place. Conversely, if it drops below HK$458.470 and loses HK$448.600, weakness could extend toward HK$445.800.
Strategy 1 | Short-term rebound play if price stabilizes above HK$460
$UBTENCT@EC2609E.C (27994.HK)$ | Strike Price: HK$580.50 | Effective Leverage: 11.3x | Strike is ~26.2% above current price, offering high elasticity—suitable for capturing rebounds after stabilization at HK$460, but avoid heavy positioning before breaking above HK$469.395
$BPTENCT@EC2609D.C (28011.HK)$ | Strike Price: HK$580.50 | Effective Leverage: 11.6x | Slightly higher leverage, ideal for early-stage short-term rebounds—focus on capturing volatility as the price moves from HK$460 toward the HK$469 resistance
$CITENCT@EC2609C.C (27751.HK)$ | Strike Price: HK$580.50 | Effective Leverage: 11.5x | Also a highly elastic rebound instrument, suitable for intraday trading; better suited for scenarios where a rebound is expected but a medium-term uptrend has not yet been confirmed
Strategy 2 | Break above HK$469.395 to confirm recovery, then chase the momentum
$BPTENCT@EC2611D.C (28707.HK)$ | Strike Price: HK$590.00 | Effective Leverage: 8.8x | Strike price is approximately 28.3% above current price; suitable for chasing the recovery move after breaking above HK$469.395—still highly responsive but more balanced than short-term high-leverage products
$BITENCT@EC2611B.C (29108.HK)$ | Strike Price: HK$588.00 | Effective Leverage: 8.2x | Slightly lower strike price, better suited for顺势 deployment after breakout; focus is on capturing the second leg of the rebound toward HK$479.243
$UBTENCT@EC2708A.C (27567.HK)$ | Strike Price: HK$580.50 | Effective Leverage: 4.7x | Longer time to expiry and lower leverage; suitable for positions opened after breakout confirmation, offering more time value and room for volatility
Strategy 3 | Break below HK$448.600 to deploy for continued weakness
$UBTENCT@EP2612A.P (14201.HK)$ | Strike Price: HK$481.61 | Effective Leverage: 4.8x | In-the-money put; leverage is moderate but provides direct exposure to downside moves—suitable for stable bearish positioning after breaking below HK$448.600
$BPTENCT@EP2611B.P (27089.HK)$ | Strike Price: HK$399.80 | Effective Leverage: 7.6x | Lower strike price; suitable for chasing extended weakness after support breakdown—better suited for scenarios where the downtrend is expected to continue beyond HK$445.800
$UBTENCT@EP2611A.P (27130.HK)$ | Strike Price: HK$399.80 | Effective Leverage: 7.1x | Slightly lower responsiveness but still sufficiently reactive; suitable for bearish positioning that retains some buffer against excessive price volatility near the money
Reply to investor inquiries
@淡淡定定長期精神: Closed near HK$480, close to the 30-day moving average at HK$479.243. To reach HK$480, the first step is to break above the key level of HK$469.395.
@@22799016: Up one day, down three days—that’s exactly the market’s current concern, as the rebound lacks strong trading volume support. Caution is still warranted until the price breaks above HK$469.395.
@231484330: If you want to add to your position, it would be safer to wait until the price breaks above HK$469.395 before considering it. Adding positions before such a breakout offers only average risk-reward potential.
@1777777777: I must hold on—it’s coming soon. If holding shares, first watch whether HK$460 can hold as support, then see if HK$469.395 can be broken. A drop below HK$448.600 would require a reassessment.
Feel free to share your insights in the comment section. For more market analysis, please continue following ‘Hong Kong Stock Warrants Jenny’ for daily updates!
Reminder: This article does not constitute any investment advice.
This article is for reference only and does not constitute any investment advice. Market data, opinions, and analysis contained herein may change at any time without prior notice. We are not responsible for any loss or damage caused by reliance on the information in this article. Technical analysis only shows whether certain technical conditions are met; asset performance should be comprehensively evaluated using other sources of information, and trading decisions should not be made solely based on this article. Please note that past performance is not indicative of future results.
#HKStocks #Real-TimeAnalysis #WarrantSelection #WarrantGuide #DerivativesHedging #HKWarrantsJenny #Tencent #00700 #Blue-ChipStocks #TechnicalAnalysis$Hang Seng Index (800000.HK)$$Hang Seng TECH Index (800700.HK)$
Risk Disclaimer: The above content only represents the author's view. It does not represent any position or investment advice of Futu. Futu makes no representation or warranty.Read more


Comments (2)
to post a comment
2