
NVIDIA's earnings report is out! Can it reignite the AI rally?
Bullish Tech Insights | Breakout or Peak? Decoding the K-line Signals Ahead of NVIDIA’s Earnings and the Market’s 'Defensive Floor'
Hello, fellow investors! Welcome to the latest episode of 'Bullish Tech Insights'!
Recently, the U.S. equity market has shown a pattern of 'index consolidation at highs, with bulls and bears locked in intense tug-of-war.'— The S&P 500 ETF $SPDR S&P 500 ETF (SPY.US)$ dipped for two consecutive sessions after hitting a recent high of $749.53 on May 14, retreating to $738.65; similarly, the Nasdaq 100 ETF$Invesco QQQ Trust (QQQ.US)$ pulled back from its high of $722.03, closing at $705.88 on May 18, both entering a phase of short-term consolidation near recent highs.The primary reason behind this is $NVIDIA (NVDA.US)$ the opening of earnings season— NVIDIA’s earnings report has transcended its status as just another stock—it has become a bellwether for the broader U.S. market’s direction. Investors are holding their breath, waiting to see what kind of 'report card' NVIDIA will deliver. This episode of 'Bullish Tech Insights' willWe’ll break down the technical trends of the major market indices and NVIDIA one by one, and outline the key levels where bulls and bears are currently clashing for your reference.
S&P 500 ETF (SPY): Short-term consolidation within a long-term uptrend

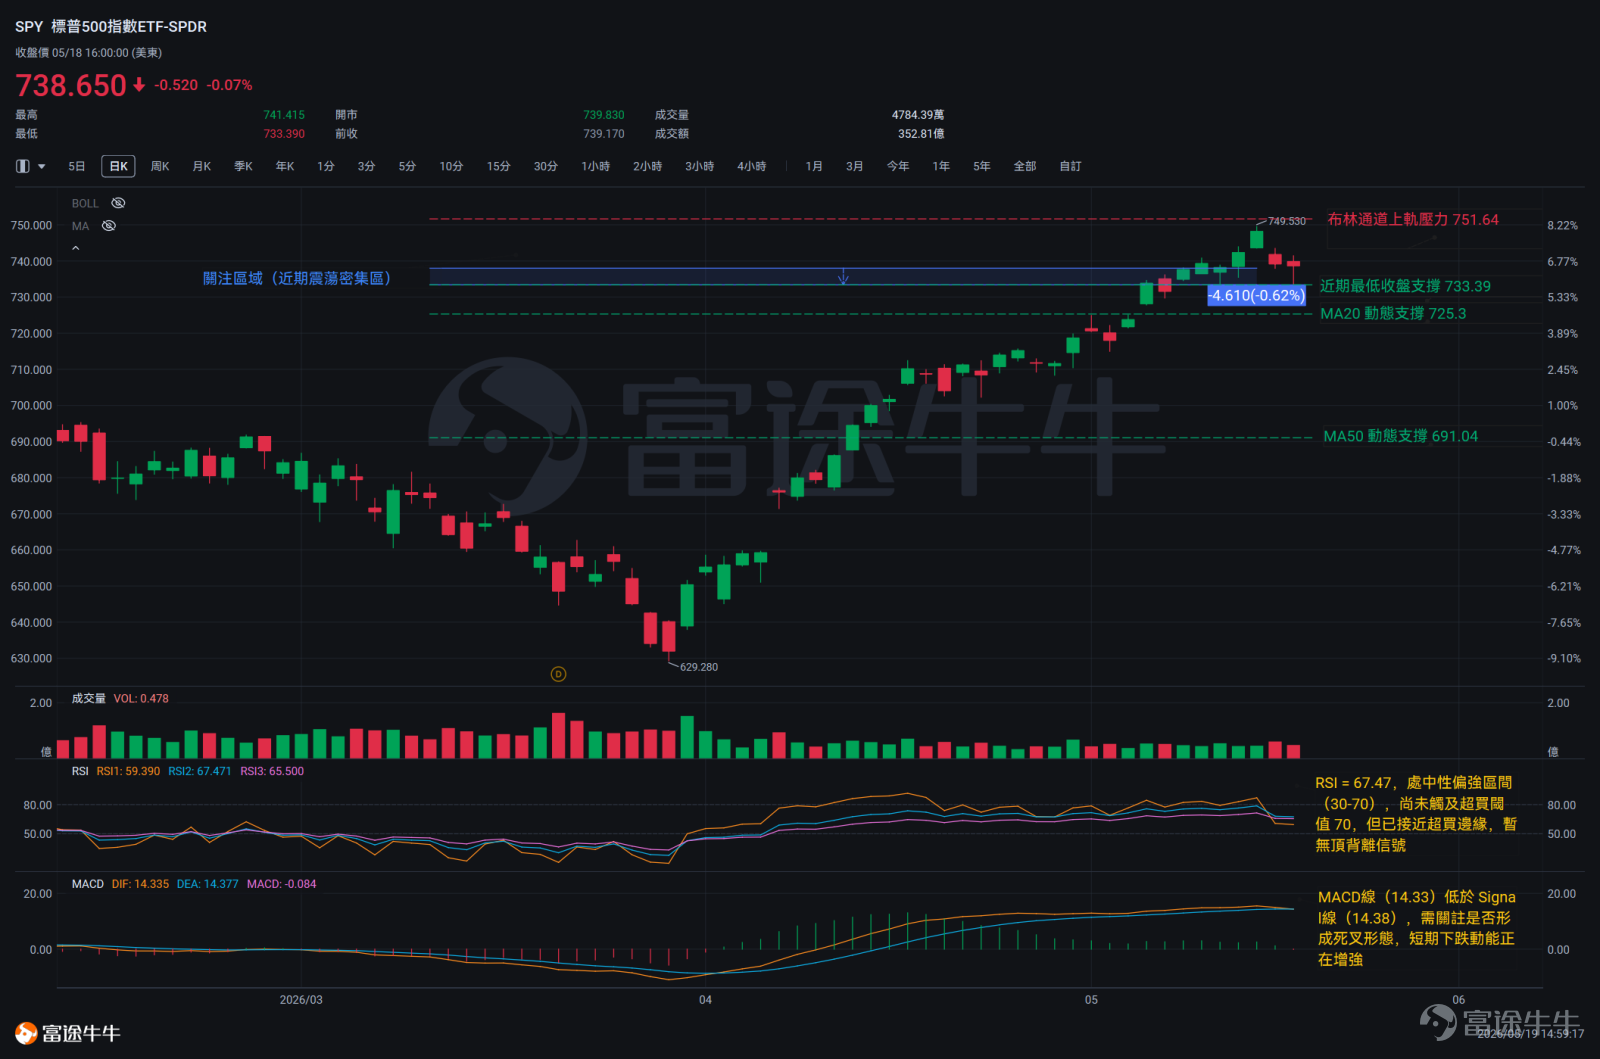
The S&P 500 ETF (SPY) remains in a healthy long-term upward channel overall.From May 6 to May 14, buyers dominated decisively, driving prices higher for several consecutive days. Although the market saw a minor pullback on May 7, the decline was fully contained within the prior day's gain—a pattern typical of brief profit-taking during an uptrend that did not disrupt the bulls’ momentum. Buyers then resumed control, pushing SPY to a recent high of $749.53 by May 14. The trend reversed near this peak. On May 15, market sentiment shifted abruptly as 'the 10-year U.S. Treasury yield breached the critical psychological level of 4.5%, while the 30-year yield firmly held above 5%.' That day, SPY opened at $741.79—below the previous close—and gapped lower, ultimately closing at $739.17, well below the midpoint of the prior day’s bullish range.
After two consecutive days of selling pressure, SPY dropped approximately $9.52. On May 18, intraday trading saw SPY plunge as low as $733.39.However, at this lower level, clear buying support emerged,lifting the closing price back up to $738.65.This suggests underlying demand at lower levels, though confirmation of the uptrend’s continuation will require monitoring closing prices over the next few trading sessions.
Key Technical Indicators Interpretation
Moving Average (MA):The 20-day moving average (MA20) at $725.30 is firmly holding above the 50-day moving average (MA50) at $691.04, confirming a solid bullish alignment and intact intermediate-term trend foundation.
RSI (67.47): It resides in the moderately strong zone (30–70). Although no clear bearish divergence signal is evident, its current level is sensitive and warrants continued monitoring.
MACD: The MACD line ($14.33) has slightly dipped below the Signal line ($14.38), raising caution over a potential death cross formation and indicating short-term momentum may be weakening.
Bollinger Bands:The price of $738.65 sits between the middle Bollinger Band ($725.30) and the upper band ($751.64), reflecting clear trending characteristics under an expanding condition, though upside room has become compressed.
Technical Comprehensive Analysis
The current price ($738.65) remains safely above the 20-day average trading cost line ($725.30), indicating thatthe intermediate-term uptrend foundation has not been compromised.Should the market continue to retrace,$733.39 (recent intraday low) and $725.30 (20-day average cost line) will serve as two critical support levels.To resume the uptrend, price mustSubstantially broke above the previous high of USD 749.53 and the upper boundary of the price trading range (USD 751.64).
Nasdaq 100 ETF (QQQ): Overheated Sentiment at High Levels and Consolidation Pressure

Similar to SPY, the Nasdaq 100 ETF (QQQ)continues to maintain its medium-term uptrend, but shows clearer signs of pressure at elevated levels.On May 12, QQQ dipped to a low of USD 696.64 and closed at USD 707.24. However, on May 13 and 14, it posted consecutive new highs (closing at USD 714.71 and USD 719.79, respectively). This swift rebound after a pullback demonstrated exceptionally strong bullish sentiment at the time. Following this run-up to a short-term peak, trading data on May 15 signaled potential near-term volatility. The session opened at USD 710.14; buyers attempted to push prices higher during the day, reaching an intraday high of USD 715.13, but were subsequently met with selling pressure, ultimately closing slightly higher at USD 708.93.This pattern of intraday strength followed by a significant retreat suggests that the momentum for a sustained one-sided rally has been severely weakened, pointing toward a higher likelihood of near-term consolidation. Further price action warrants close monitoring.
Key Technical Indicators Interpretation
Moving Average (MA):The 20-day moving average (MA20) at USD 725.30 remains firmly above the 50-day moving average (MA50) at USD 691.04, confirming an intact medium-term uptrend channel.
RSI (69):approaching the overbought threshold of 70, making it the most cautionary indicator recently; no clear bearish divergence has emerged yet, and an overbought signal has not been triggered.
MACD:MACD line (23.37) > Signal line (22.97), indicating that momentum remains in an expansion phase, though an early-stage bearish divergence may be forming; continued observation is needed to see if the histogram narrows.
Bollinger Bands:The price of $705.88 lies between the middle Bollinger Band ($683.31) and the upper band ($731.63), closer to the middle band, with current volatility expanding.
Technical Comprehensive Analysis
The intermediate-term bullish structure remains intact, but short-term topping warning signals have emerged, with RSI in overbought territory.Short-term correction pressure objectively exists.On the support side,$705.55 and $698.85 (recent intraday low concentration zone over the past two days) serve as key short-term bullish defense levels. Should the price break below the psychological $700 level and confirm this move decisively, attention will turn to whether the $683.31 level (dynamic MA20 support) can hold.
NVIDIA (NVDA): Directional Decision Ahead of Earnings Release

On May 18, buyers and sellers engaged in intense tug-of-war. The price reached an intraday high of $230.00 and a low of $218.37, ultimately closing at $222.32. Data indicates that while buyers were willing to step in near $218, selling pressure above $229 was extremely strong, resulting in an overall weak price action for the day.Overall, NVIDIA is currently in a short-term consolidation phase, awaiting earnings results.
Key Technical Indicators Interpretation
Moving Average (MA):The MA20 ($211.31) remains firmly above the MA50 ($193.96), maintaining a complete bullish alignment and a stable uptrend.
RSI (61.66):In a moderately bullish zone, with no bearish divergence signal yet; price rose from USD 196.5 to USD 235.74 over the past 10 days before pulling back to USD 222.32, and RSI shows no clear divergence pattern, indicating no short-term overheating warning.
MACD:The MACD line (9.06) remains above the Signal line (7.8), maintaining a golden cross, with overall bullish momentum; however, watch for potential histogram contraction following two consecutive bearish candles.
Bollinger Bands:Current price of USD 222.32 is trading between the middle Bollinger Band (USD 211.31) and upper band (USD 233.15), reflecting an expanding state with elevated volatility and ongoing trend characteristics.
Technical Comprehensive Analysis
Ahead of the upcoming earnings season, if NVIDIA’s share price declines,the recent dense trading zone low (USD 219.44) and the 20-day moving average (USD 211.31) will provide primary support.If earnings and forward guidance exceed expectations,it could propel the stock above its recent high of USD 235.74 and extend the upward trend.

Here’s some great news to share with everyone,The new “AI-Created Indicators” feature is now live on NiuNiu Desktop!
Want your own custom indicator? Now, just give a simple instruction and AI will generate it for you! Plus, you can backtest with one click—no coding required—and instantly see your potential returns. Give it a try today!
Risk Disclaimer: The above content only represents the author's view. It does not represent any position or investment advice of Futu. Futu makes no representation or warranty.Read more


Comments (4)
to post a comment
31
10