
Hong Kong Market Compass: US-Iran deal reached! Is it time for a Hong Kong market rebound?
In-Depth Analysis: Three Major Competitive Landscapes of Hong Kong ETFs, How Much Do You Know from Q&A
In-depth Analysis: Three Competitive Dynamics of the Hong Kong ETF Market, Questions and Answers
The competitive landscape of the Exchange-Traded Fund (ETF) market on the Hong Kong Exchange is deeply shaped by market structure. Historical accumulation, execution efficiency, and regulatory changes collectively determine issuers' differentiated paths. Within this framework:
- Is the 'first-mover advantage' always decisive?
- Can the largest ETF by asset size always win based on fees?
- And when products are no longer completely homogeneous, how do the rules of competition change?
This article will explore three interactive questions, focusing on three key sectors in Hong Kong—the Hang Seng Index, Hang Seng Tech Index, and '60/40 Equity ETFs'—to examine how first-mover advantage, distribution networks, and regulatory benefits jointly determine capital flows and product viability.
First Track: Hang Seng Index Tracking ETFs
01
Among the many ETFs tracking the Hang Seng Index, which fund holds a dominant position in terms of market share (or liquidity)?
A. Hang Seng Index ETF
(HS HSI ETF, 2833.HK)
B. Tracker Fund of Hong Kong
(TraHK, 2800.HK)
C. iShares Core Hang Seng Index ETF
(iShares Core HSI ETF, 3115.HK)
D. CSOP Hang Seng Index ETF
(CSOP HSI ETF, 3037.HK)
(Answer: B)
The Hang Seng Index-tracking ETF has long been dominated by a single product - Tracker Fund of Hong Kong (TraHK, 2800.HK)The dominant hierarchical structure, whose origins can be traced back to the initial policy starting points, scale advantages, and liquidity lock-in effects.
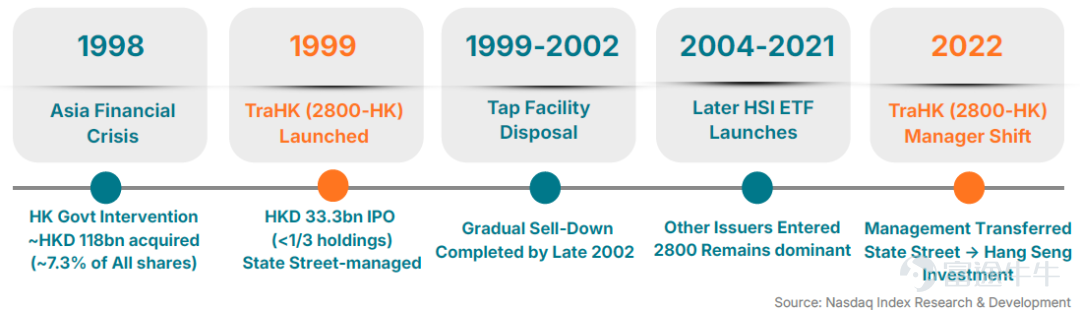
The Tracker Fund of Hong Kong (TraHK), based on the Hong Kong SAR Government's large-scale market intervention in 1998,(Figure 1), orderly released shares during 1999–2002 through a continuous offering mechanism (Tap Facility). It far surpassed subsequent similar products (such as 2833.HK, 3115.HK, 3037.HK) in terms of asset size and trading activity, quickly becoming the main tool for institutions to gain Hang Seng Index exposure.

Figure 1: Development Timeline of the Tracker Fund of Hong Kong (TraHK)
In 2022, the change of fund manager, reduction in fees, and the delisting of 2833.HK all contributed to the concentration of Hang Seng Index tracking ETF funds and liquidity towards the Tracker Fund of Hong Kong (TraHK).(Figure 2)。

Figure 2: The Tracker Fund of Hong Kong (TraHK) holds a dominant position in terms of assets under management.
Second Track: Hang Seng Tech Index Tracking ETF
02
Among Hang Seng Tech Index Tracking ETFs, despite significantly higher management fees compared to peers, it maintains a leading position in terms of asset size and capital inflows.
A. Hang Seng Tech ETF
(HS HSTECH ETF, 3032.HK)
B. ChinaAMC Hang Seng Tech ETF
(ChinaAMC HSTECH ETF, 3088.HK)
C. iShares Core Hang Seng Tech ETF
(iShares Core HSTECH ETF, 3067.HK)
D. CSOP Hang Seng Tech ETF
(CSOP HSTECH ETF, 3033.HK)
(Answer: D)
The listing reform in Hong Kong in 2018 reshaped its stock market landscape, making it easier for large technology companies to list or relist on the Hong Kong Exchange. With these reforms in place, many major internet and platform companies such as Alibaba, Meituan, JD.com, NetEase, and later Kuaishou, chose Hong Kong as their primary or secondary listing venue. As these large-cap companies entered the market, the prominence of tech stocks in Hong Kong's equity market increased significantly, gradually emerging as a new investment theme.
Following the launch of the Hang Seng Tech Index in 2020, multiple institutions aggressively positioned themselves with related ETFs.(Figure 3)。CSOP (3033.HK)Despite a management fee of 0.99%, significantly higher than industry peers (0.25% - 0.55%), its assets under management have consistently outpaced those of later-listed Huaxia Hang Seng Tech (3088.HK), iShares (3067.HK), and Hang Seng Tech ETF (3032.HK).

Figure 3: Assets Under Management of Hang Seng Tech ETFs
Looking at capital flows, although the technology sector experienced continuous pullbacks since 2021, no systemic capital outflows occurred across the various ETFs. However, by the end of 2025, noticeable divergence in flows emerged: iShares recorded net outflows, while CSOP continued to see net inflows.(Figure 4)。
Differences in portfolio structure were also key: According to data from the Hong Kong Exchange's Central Clearing and Settlement System (CCASS), the Stock Connect holdings ratio for 3033.HK was approximately 61% in October 2025, rising to around 68% by March 2026; whereas for 3067.HK, this ratio remained below 1%. Higher participation through Stock Connect meant that 3033.HK had easier access to mainland capital, potentially supporting its sustained AUM growth and divergent capital flows.

Figure 4: Cash Flows of the Hang Seng Tech ETF Tracker
Thus, as exposure to Hang Seng Tech stocks becomes increasingly homogenized, precise targeting via distribution channels and the ability to retain specific pools of capital may surpass fee considerations as the core determinant of product size. At this point, differences in investor composition will translate into divergent capital flows, leading to an ever-widening gap in assets under management.
Third track: 60/40 equity ETFs
03
Under the new regulations for ETF Connect in July 2024, the asset structure of '60/40 equity ETFs' emerging in the Hong Kong market is:
A. 60% Hang Seng Index components + 40% Hong Kong government bonds
B. 60% Hong Kong stock allocation (meeting Southbound Connect threshold) + 40% overseas stock allocation
C. 60% blue-chip stocks + 40% Hang Seng Tech Index components
D. 60% cash assets + 40% equity derivatives
(Answer: B)
After the implementation of the new Southbound ETF Connect (ETF Connect) regulations in July 2024, the minimum allocation ratio for Hong Kong stocks was reduced from 90% to approximately 60%, resulting inthe emergence of a new product structure with '60% Hong Kong stocks + 40% overseas stocks,' known as the '60/40 equity ETF.' This rule adjustment broke the previous homogenized competition and encouraged issuers to shift towards differentiated positioning.(Chart 5)。

Chart 5: Issuance timeline and AUM of 60/40 equity ETFs
Mirae Asset (Global X), as a pioneer, was the first to launch a low-cost Hong Kong-US technology 60/40 equity ETF (3402.HK), establishing the basic framework for such products. However, the initial scale was relatively modest, and the fund has yet to reach the required AUM threshold for inclusion in the southbound ETF Connect.
Since then, more institutions have gradually joined the market, and the current distribution of AUM is as follows:
– CSOP, which entered this market relatively early, has launched three 60/40 equity ETFs. Its Hong Kong-US Technology and Income Strategy products (3442.HK, 3441.HK) have successfully been included in the southbound ETF Connect. Subsequently, it also launched a Hong Kong-Korea Technology ETF (3431.HK) covering the Korean market while maintaining a relatively higher fee structure. Leveraging its first-mover advantage and the southbound inclusion mechanism, CSOP now accounts for 40% of the 60/40 product market share;
– E Fund, as a late entrant, has rapidly expanded its product offerings, issuing six 60/40 products within about half a year. The ETF AUM remains concentrated in early high-dividend and thematic ETFs, such as high-dividend products combining stocks from Hong Kong, Australia, and Japan (3483.HK), and thematic ETFs covering artificial intelligence and gold mining (3489.HK, 2824.HK). Later products currently have smaller AUM, reflecting the strategy of enhancing product competitiveness by expanding into new investment regions and themes. It now holds 30% of the market share for similar products;
– Other institutions focus on niche verticals, adhering to diversified strategies. For instance, Bosera adopted a more focused allocation framework, launching an ASEAN-oriented product (2805.HK), which became the first ETF to include ASEAN exposure in the 60/40 structure.
This demonstrates that regulatory innovation has provided institutional space for expanding the product matrix, with competition focusing on index design capabilities, thematic breadth, and product issuance speed.
In Hong Kong, new ETF segments typically emerge alongside policy or regulatory changes, especially those related to the Mainland’s “Stock/ETF Connect” mechanism. In highly homogenous product sectors, competition outcomes primarily depend on first-mover advantages and distribution capabilities. In contrast, the relaxation of the regulatory environment has opened up space for differentiated product positioning, although the final market landscape is still evolving.
The information contained in this communication document includes forward-looking statements involving various risks and uncertainties. Nasdaq hereby advises readers that any forward-looking information does not constitute a guarantee of future performance, and actual results may differ materially from the contents of the forward-looking information. Forward-looking statements can be identified by terms such as "will" and "believe," along with similar expressions. Such statements involve numerous risks, uncertainties, or other factors beyond Nasdaq's control. These risks and uncertainties are detailed in Nasdaq's filings with the U.S. Securities and Exchange Commission (SEC), including its annual reports on Form 10-K and quarterly reports on Form 10-Q, published on Nasdaq's investor relations website (http://ir.nasdaq.com) and the SEC's official website (www.sec.gov). Nasdaq has no obligation to publicly update any forward-looking statements, whether due to new information, future events, or otherwise.
Nasdaq® is a registered trademark of Nasdaq, Inc. The information provided above is for reference and educational purposes only, and none of the content in this article should be considered as investment advice representing a specific security or overall investment strategy. Neither Nasdaq, Inc. nor any of its affiliates provides recommendations on buying or selling any securities, nor do they make any statements regarding the financial condition of any company. Statements about Nasdaq-listed companies or Nasdaq proprietary indices are not guarantees of future performance. Actual results may differ significantly from those expressed or implied. Past performance is not indicative of future results. Investors should conduct their own due diligence and carefully evaluate companies before investing. It is strongly recommended to seek advice from securities professionals. Any discrepancies or divergences caused by translation are non-binding and have no legal effect on compliance or enforcement. If there are any questions about the information provided in this translation, please refer to the English version.

Yinan Xiao
CFA
Nasdaq Index Research and Development Department
Senior Analyst

Phoebe Wang
CFA
Nasdaq Index Research and Development Department
Senior Director
Click to view related articles
You can also search for 'Nasdaq_Global' on WeChat to follow us!
Click 'Read Original' to view the full analysis report
Risk Disclaimer: The above content only represents the author's view. It does not represent any position or investment advice of Futu. Futu makes no representation or warranty.Read more

Comments
to post a comment
1
2