
Hong Kong Market Barometer: CPO, PCB, and memory stocks rally in rotation! Are you on the right trai
If Baidu holds above 133.9 yuan, there is still potential for a rebound, but what retail investors are truly waiting for is the signal of renewed strength at 137 yuan.
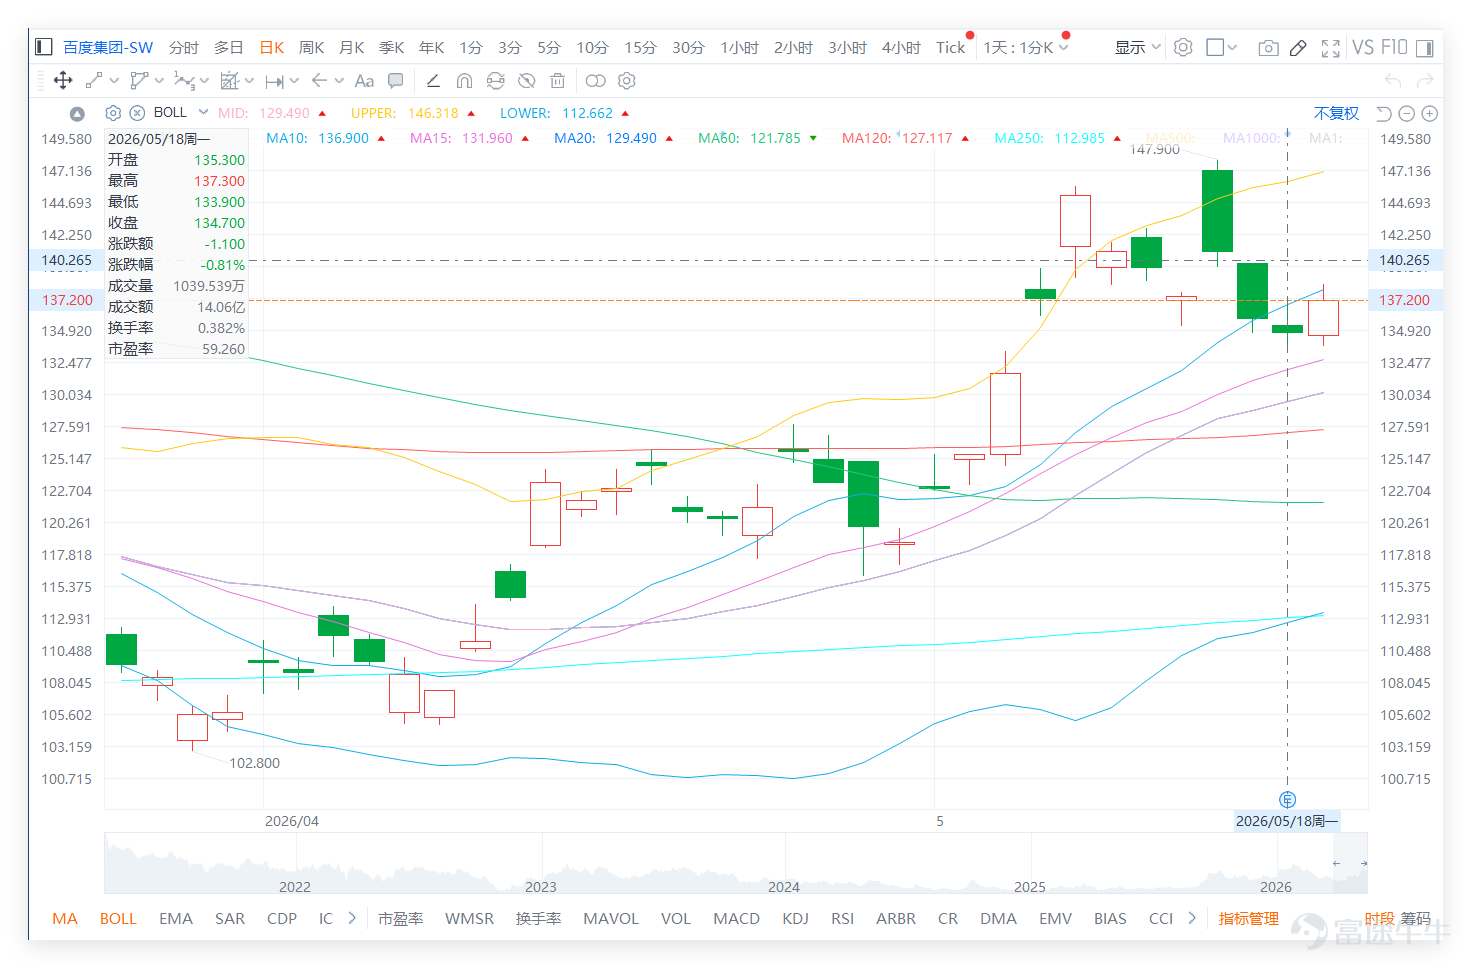
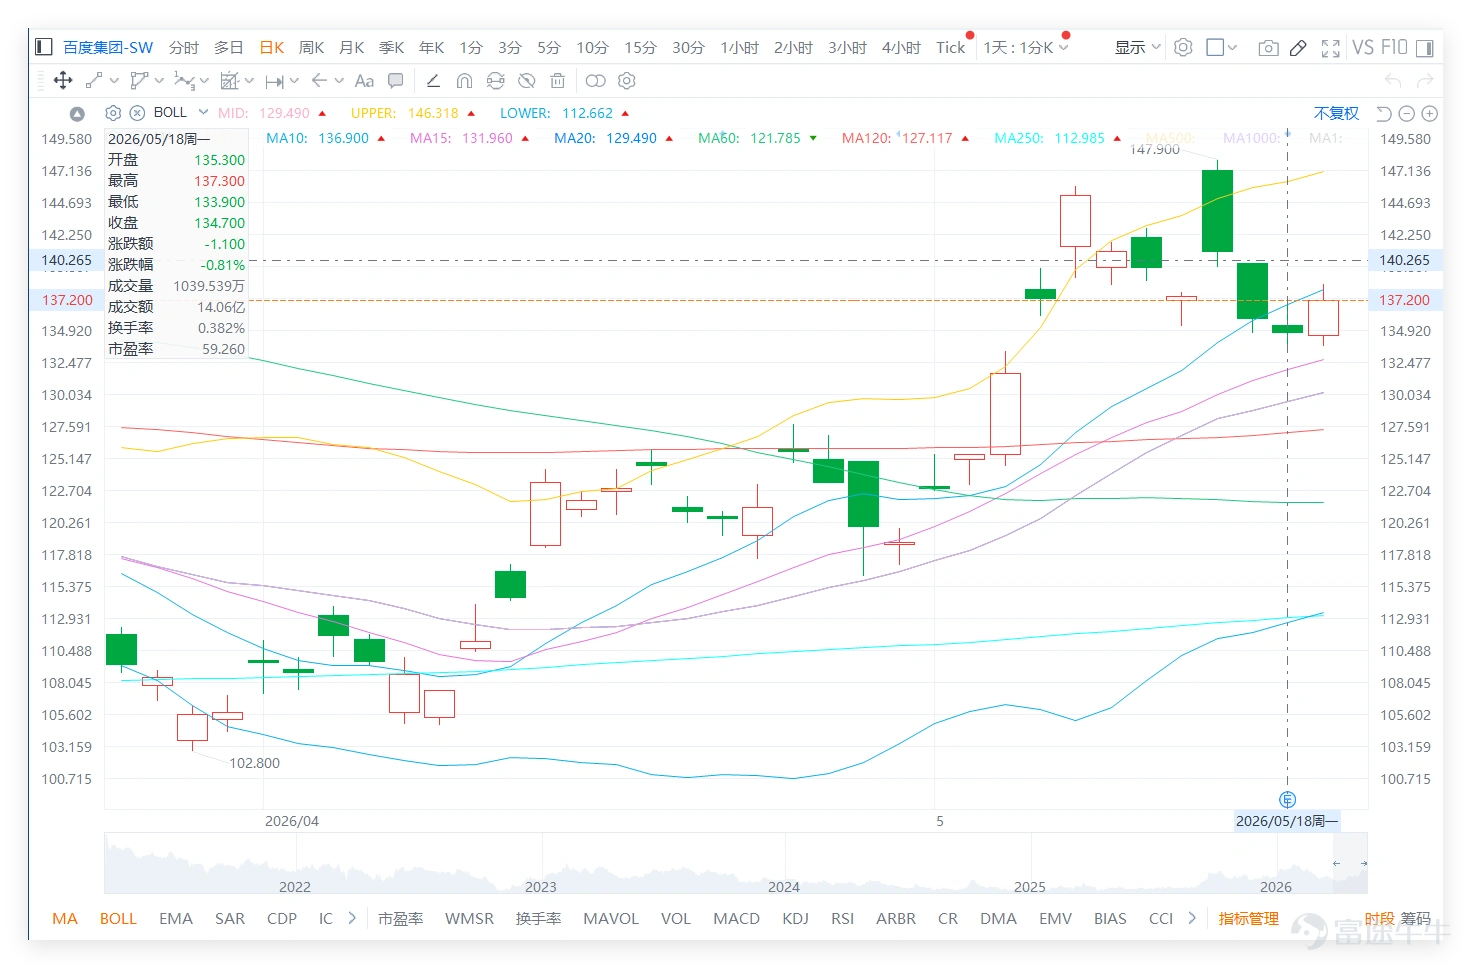
$BIDU-SW (09888.HK)$ The previous day (18th) closed at 134.700 yuan, with the short-term trend still consolidating after a rebound. The current price of 134.700 yuan is above the 20-day moving average of 129.490 yuan and the 30-day moving average of 123.873 yuan, indicating that the intermediate and short-term structure has improved and is no longer in the previous one-sided weak trend; however, the stock price remains below the 10-day moving average of 136.900 yuan, reflecting that the short-term upward momentum is beginning to slow. In other words, Baidu is not completely weakening but is entering a consolidation phase after a rebound, with the market awaiting confirmation of the next directional move.
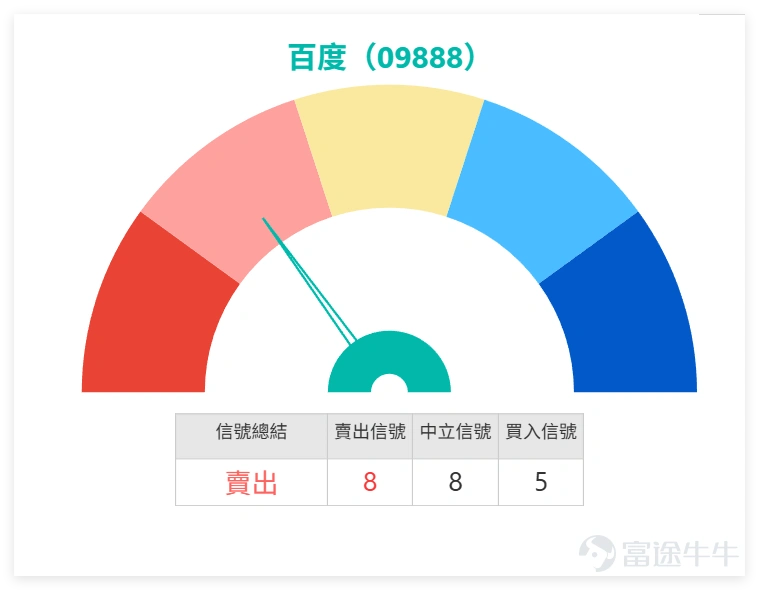
Baidu's technical signal is 'Sell' (consolidation at highs). In comparison to peers, $TENCENT (00700.HK)$ closed at 449.20 yuan, with an RSI of around 33, giving a technical signal of 'Buy' (deeply oversold); $BABA-W (09988.HK)$ closed at 131.70 yuan, with an RSI of around 47, giving a technical signal of 'Buy' (neutral recovery); $JD-SW (09618.HK)$ closed at 126.50 yuan, with an RSI of around 59, giving a technical signal of 'Sell' (pressure at highs). This shows a clear divergence within the tech sector: Tencent is in an oversold rebound area, Alibaba is in a neutral recovery area, while Baidu and JD.com are at relatively high levels facing profit-taking pressure, meaning the entire sector is not uniformly strong.
Based on investor comments, sentiment around Baidu is quite concentrated: on one side, expectations are high for news or capital actions to reignite speculative interest, while on the other, doubts persist about whether AI models, chips, and commercial logic can sufficiently support continued stock price gains. This divergence aligns well with the current price position: technically, the price remains above the middle axis of the Bollinger Bands, without destroying the rebound structure, yet in the short term, it has failed to break through the critical level near 137 yuan. Thus, bulls still have reasons to hope, and bears also have room to maneuver.
Bullish comments mainly focus on several directions. Some investors are directly optimistic about significant stock price increases, while others are paying attention to IPO details and dual-listing timelines, believing that any new announcements could serve as short-term catalysts. Additionally, some investors think the current situation reflects volume contraction during a consolidation phase, possibly a shakeout, worrying that large players might suddenly push prices up. These comments reflect that bulls aren't just looking at low prices, but rather believe that Baidu may still benefit from potential news catalysts and renewed fund inflows.
Another source of bullish sentiment stems from expectations of a contrarian rise. Some investors believe that when negative opinions emerge in the market, it could instead signal an entry opportunity. This indicates that some in the market still view the current consolidation as a digestion of selling pressure, rather than the end of an uptrend. From a technical perspective, Baidu's current price remains above the 20-day and 30-day moving averages, with the middle axis of the Bollinger Bands around 129.490 yuan, clearly keeping the stock in a relatively strong range. As long as support at 133.900 yuan holds, the rebound structure remains intact for now.
However, concerns raised by bearish comments should not be ignored. Some investors express clear doubts about the performance of Baidu’s AI models, even suggesting that collaborations are difficult to advance. Others question the actual progress of Kunlun chips, arguing that if there is only hardware computing power without adequate AI applications and commercial follow-through, the final business logic remains unclear. These bearish views collectively highlight the core questions the market has regarding Baidu's AI narrative: while the capital markets can speculate on chips, large models, and AI applications, ultimately, a clear path to commercialization and profitability must be visible.
This is precisely why Baidu's current stock price is struggling to break through directly. Technically, Baidu still has a basis for a rebound; but sentiment-wise, the market does not fully agree with its AI story. If the stock price wants to test the 146 yuan area further, relying solely on conceptual expectations may not be enough—it still needs news, trading volume, and price breakthroughs working together. Otherwise, even if there is a short-term spike, if it fails to break through 137 yuan and stabilize, the market will view this as a pullback after a rebound, not the start of a new upward trend.
The观望留言 reflect that retail investors are currently most concerned about two things.
First, the timing and content of earnings reports or announcements. Some investors are directly asking what time Q1 results will be released, while others are wondering if there will be any miracles in the earnings report.
Second, whether the market is trying to suppress the stock price through media or commentary, allowing capital to accumulate shares at lower prices.
This shows that the current market attention on Baidu is no longer just about its chart position but is focused on upcoming information changes. Retail investors want to know whether the stock price is waiting for a breakout on news or preparing to pull back after consolidating at higher levels.
From a technical analysis perspective, the first key level for Baidu currently is the support at 133.900 yuan. As long as this level holds, the current price is still within the normal range of a rebound structure. The second key level is around 137 yuan, which acts as a watershed. Since the 10-day moving average is near 136.900 yuan, if the stock price can rise above 137 yuan again, it would indicate a short-term recovery of the short-term moving average, giving the market a chance to regain upward momentum. If the breakthrough above 137 yuan is supported by trading volume, the next significant target would be the 146 yuan area.
On the other hand, if Baidu falls below 133.900 yuan, short-term consolidation pressure will increase, but the real larger risk lies at 127.834 yuan. If even 127.834 yuan is breached, the rebound structure could be damaged, and the stock price might return to a weaker pattern. Therefore, current operations cannot focus solely on daily fluctuations; instead, one must look at whether the stock price remains above 133.900 yuan and whether it can break through 137 yuan again. These two levels are sufficient to determine whether Baidu will continue its short-term rebound or enter a deeper consolidation phase.
Regarding trading volume, during the recent rebound phase, volume increased significantly, reflecting some inflow of funds, which is a positive sign for Baidu. However, trading volume has started to decline recently, indicating weakening upward momentum at higher levels. During the consolidation phase, the lack of sharp increases in volume shows that selling pressure is still under control, but it also suggests that buying power has not been consistently pushing prices higher. This kind of trading structure is best described as “waiting for confirmation after a rebound” rather than a “full strengthening.”
Thus, Baidu’s current risk-reward ratio is moderately high but still requires confirmation. It has a stronger rebound foundation compared to stocks that have already broken below major support levels because it is still above the 20-day and 30-day moving averages and remains above the middle axis of the Bollinger Bands. However, it is not a strong stock that can be chased unconditionally because it is still below the 10-day moving average, has yet to reclaim the 137 yuan watershed, and trading volume has begun to decline. For short-term traders, a reasonable strategy would be to hold above 133.900 yuan and watch for consolidation, with a further upward test toward 146 yuan only upon breaking through 137 yuan. If it breaks below 127.834 yuan, one should acknowledge that the rebound structure may have been damaged.
Overall, Baidu’s issue now is not a complete lack of capital or a total absence of a story, but that the market is waiting for it to prove with price action that the story remains valid. Retail investors can continue to pay attention to factors like earnings reports, IPO details, dual-listing timelines, AI models, and chip commercialization. But when it comes to actual trading, focus should return to three key levels: 133.900 yuan as short-term support, 137 yuan as the turning point for strength, and 146 yuan as the upside target if the rebound expands. Before breaking through 137 yuan, Baidu remains in consolidation after a rebound; only after breaking through and stabilizing above 137 yuan will the market have reason to look higher.
Latest update (May 19 morning):
Baidu's latest price is HK$137.00, up approximately 1.71%. If today’s (April 19) closing price can remain above HK$137, it will help confirm a short-term bullish signal, with the next target at the HK$146 range.
Reply to some investors' views:
@車肥羊If details about an IPO or dual listing timeline are announced, it could indeed stimulate sentiment, but the share price must first break through HK$137 to technically reconfirm strength.
@赚钱小陈Consolidation with shrinking volume could indicate a washout, as selling pressure has not yet sharply increased. However, confirmation of institutional buying will depend on whether the price can break through HK$137.
@钟爱财报的梦想家Rising against the trend can serve as a positive signal, but Baidu has yet to return near its 10-day moving average; first, we need to see if it can break through HK$137.
Based on the above analysis, the strategies for deployment can be divided into the following main approaches:
Key strategy: For Baidu in the short term, watch whether support at HK$133.900 holds. If it does, a continued rebound may be expected. If it breaks back above the HK$137 watershed, the target moves to the HK$146 range. However, if support below HK$127.834 is broken, the rebound structure could be damaged, requiring a shift to defense.
Strategy One | Hold steady at 133.900 yuan for a rebound continuation
$UBBAIDU@EC2609A.C (28166.HK)$ | Strike price 140 yuan | Actual leverage 4.7x | Strike price close to upper resistance zone, suitable for betting on a short-term rebound if the stock price holds above 133.900 yuan, focusing on capturing the initial rebound after consolidation strengthens again
$BIBAIDU@EC2609A.C (28265.HK)$ | Strike price 140 yuan | Actual leverage 4.7x | Also close to the watershed above 137 yuan, suitable for stable rebound strategies when the stock price has not broken support but hasn't officially surged yet
$CTBAIDU@EC2609A.C (27915.HK)$ | Strike price 140 yuan | Actual leverage 4.6x | Slightly lower leverage, suitable for those wanting to participate in the rebound without being overly aggressive; used when the stock price stabilizes and gradually recovers above 137 yuan
Strategy Two | Break through 137 yuan to chase upward momentum towards 146 yuan
$UBBAIDU@EC2610A.C (27686.HK)$ | Strike price 151.21 yuan | Actual leverage 4.5x | Strike price higher than the 146 yuan resistance zone, suitable for chasing continued rebound after confirming a break above 137 yuan, aligned with targeting the 146 yuan region
$BIBAIDU@EC2610A.C (27655.HK)$ | Strike price 151.21 yuan | Actual leverage 4.5x | Same strike price of 151.21 yuan, suitable for following up after a breakout; product elasticity directly reflects scenarios where the stock pushes toward 146 yuan or higher
$GJBAIDU@EC2610A.C (28323.HK)$ | Strike price 151.21 yuan | Actual leverage 4.4x | Slightly lower leverage, suitable for conservative momentum chasing after a breakout; used when the stock price has stabilized above 137 yuan but acceleration is not yet fully confirmed
Strategy Three | Turn bearish after breaking below 127.834 yuan
$UBBAIDU@EP2607B.P (24276.HK)$ | Strike price 131.7 yuan | Actual leverage 5.0x | Strike price near current price downside, suitable for capturing downward continuation after the stock price breaks below 127.834 yuan, indicating breakdown of rebound structure
$MSBAIDU@EP2607B.P (24501.HK)$ | Strike Price 131.7 yuan | Actual Leverage 5.1x | Higher leverage, suitable for aggressive bearish strategies; the use case is expanding selling pressure after breaking through key support, where short-term high responsiveness is required
$BIBAIDU@EP2607B.P (24326.HK)$ | Strike Price 131.7 yuan | Actual Leverage 5.1x | Similarly close to the critical area below, suitable for trend-following strategies after breaking through support, ideal for capturing the first leg of decline from consolidation weakening
For more market analysis, stay tuned to Jenny's daily updates on 'Hong Kong Stock Warrants'!
Reminder: This article does not constitute any investment advice.
This article is for reference only and does not constitute any investment advice. Market data, opinions, and analysis contained herein may change at any time without prior notice. We are not responsible for any loss or damage caused by reliance on the information in this article. Technical analysis only shows whether certain technical conditions are met; asset performance should be comprehensively evaluated using other sources of information, and trading decisions should not be made solely based on this article. Please note that past performance is not indicative of future results.
#HKStocks #Baidu #Real-TimeAnalysis #WarrantSelection #WarrantGuide #DerivativesHedging #HKWarrantsJenny #Blue-ChipStocks #TechnicalAnalysis
Risk Disclaimer: The above content only represents the author's view. It does not represent any position or investment advice of Futu. Futu makes no representation or warranty.Read more

Comments
to post a comment
2
1