
As geopolitical risk premiums fade and Waller turns hawkish, when will precious metals hit bottom?
Zijin Mining has dropped near the lower Bollinger Band. Retail investors are still in a bargain-hunting mood, but the key issue is whether it can hold above 33.520 yuan.
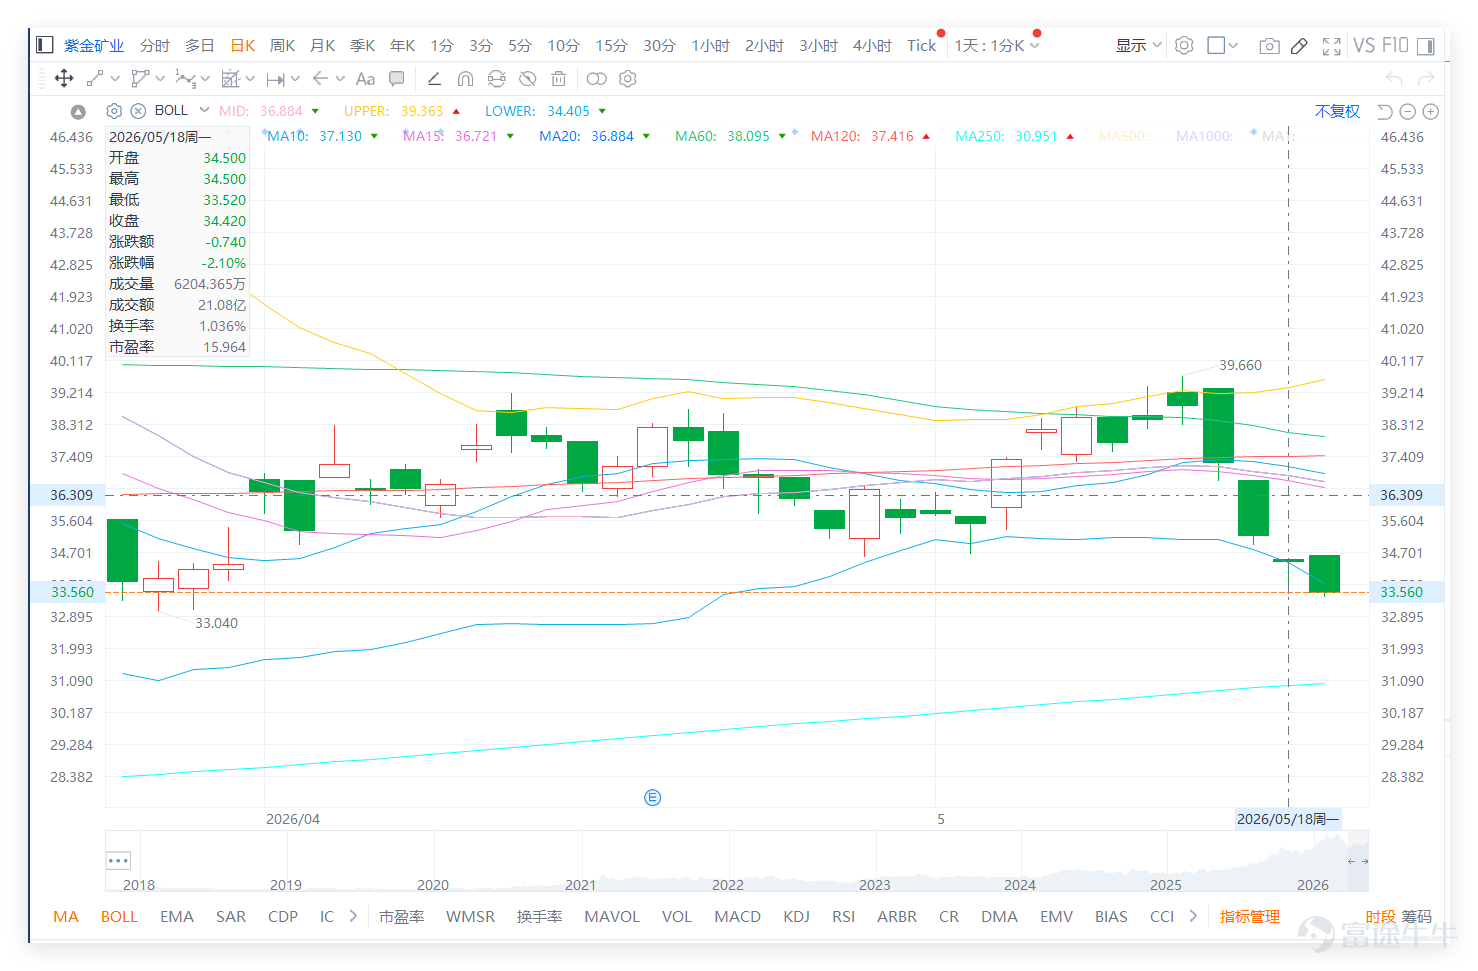
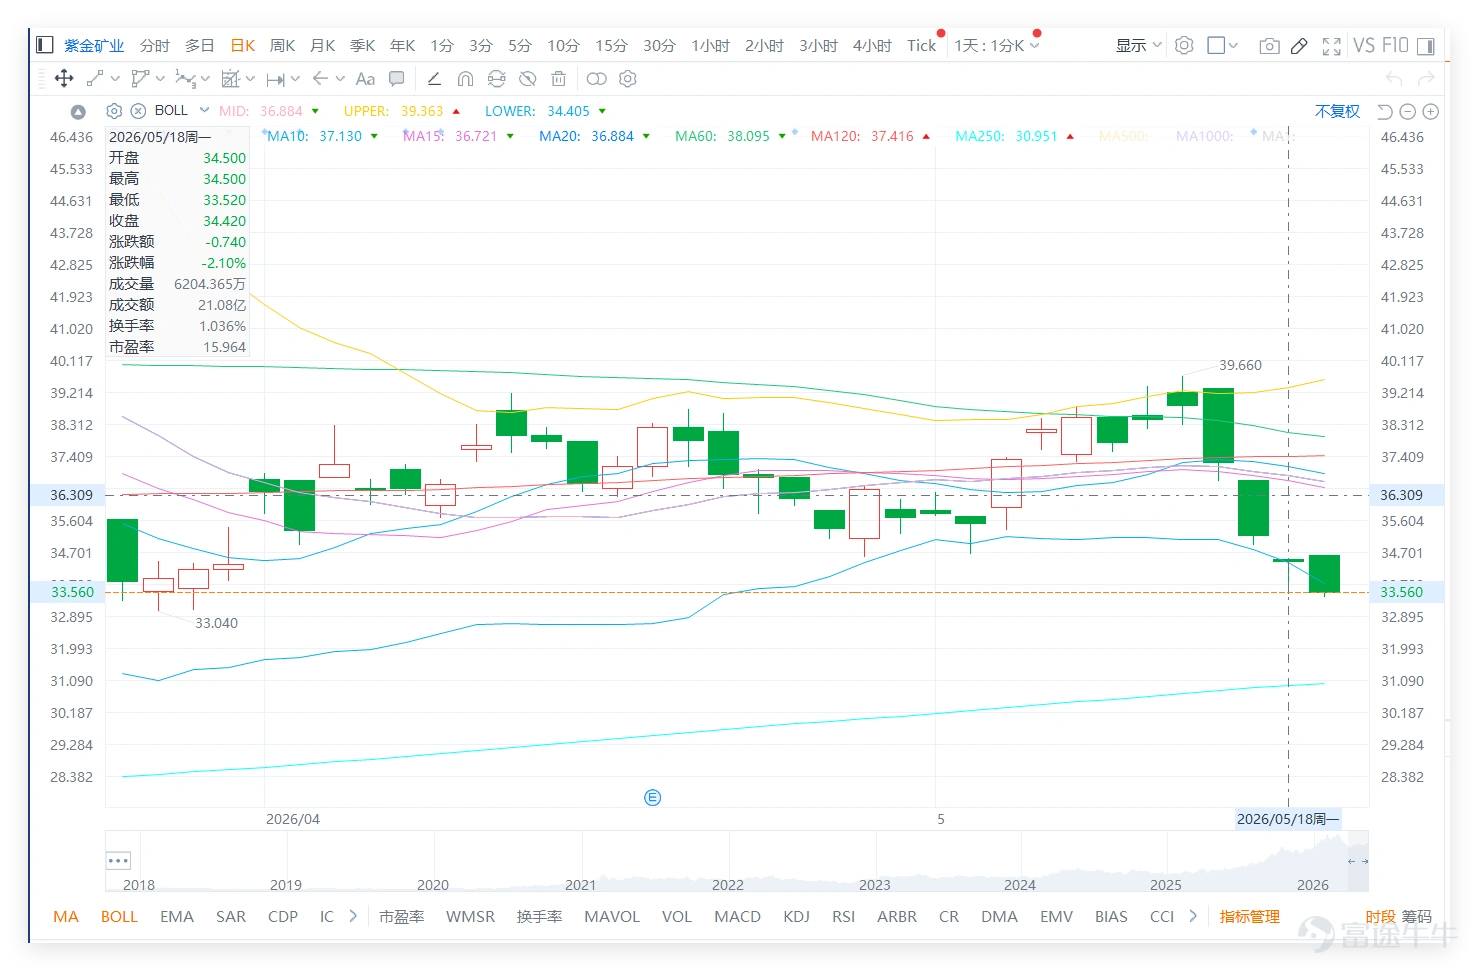
$ZIJIN MINING (02899.HK)$ The previous trading day (18th) closed at 34.420 yuan, with the short-term trend showing clear weakness. The stock price is now below the 10-day moving average of 37.130 yuan, the 20-day moving average of 36.884 yuan, and the 30-day moving average of 36.875 yuan, indicating that the short- to medium-term structure has turned bearish again. The current price is also close to the lower Bollinger Band at 34.405 yuan, reflecting that selling pressure has pushed the market into a weak short-term zone. Although the Relative Strength Index (RSI) has dropped to near 26, close to an oversold level, no clear bottoming signal has appeared yet, so we cannot assume the stock has bottomed out just because it has fallen sharply.
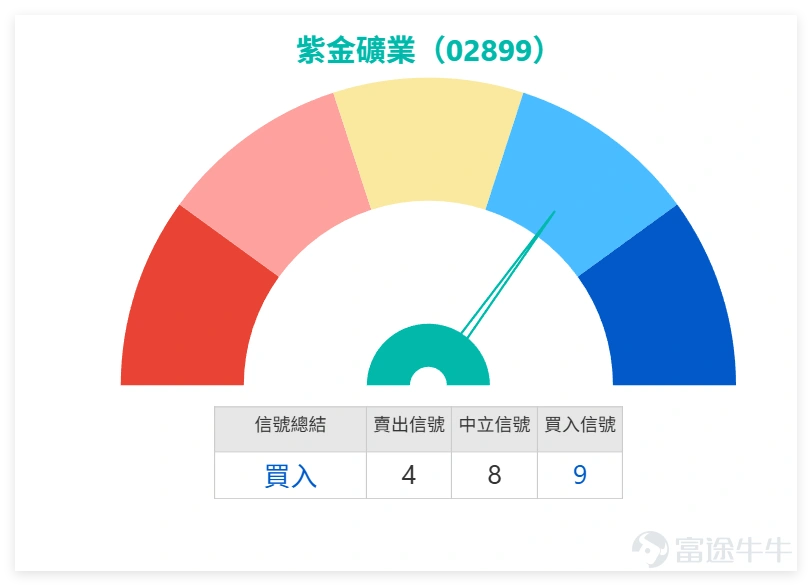
Zijin Mining's technical signal is 'Buy' (oversold rebound). Compared to peers, $ZHAOJIN MINING (01818.HK)$ Closed at 23.24 yuan, with an RSI of about 25, the technical signal is 'Buy' (extremely oversold); $SD GOLD (01787.HK)$ Closed at 26.44 yuan, with an RSI of about 31, the technical signal is 'Buy' (deeply oversold); $JIANGXI COPPER (00358.HK)$ Closing at HKD 35.94, with an RSI of approximately 43, the technical signal is "neutral". This indicates that the non-ferrous metals sector as a whole is in the "oversold recovery after a deep correction" phase. Gold stocks (Zijin Mining, Shandong Gold) have experienced deeper corrections. Although Zijin Mining has buy signals supporting it, this is more about expectations for a rebound after a sharp decline rather than confirmation of a trend reversal.
Looking at the sentiment in the comments, there is a clear divergence in Zijin Mining’s market right now. On one side are long-term optimistic investors who believe the company remains a leader with strong profitability, making the drop an attractive buying opportunity. On the other side are short-term pessimists who think the stock has broken through several important moving averages, signaling continued weakness and potential drops to 30 yuan, 27 yuan, or even lower. Behind this divergence is not necessarily a difference in understanding of the company, but rather different investment horizons. Long-term capital focuses on leadership and profitability, while short-term capital looks at downward trends, selling pressure, and support levels.
The focus of bullish comments mainly centers on three directions.
First, there is still sentiment for bottom-fishing at low levels. Some investors mentioned that large funds were used to buy the dip on Friday, while others directly considered the current price of HKD 34.420 to be a bargain and suitable for bottom-fishing.
Second, long-term confidence remains strong. Some investors expressed that they still hold a positive outlook, will not sell, and plan to hold long-term. Some even stated they won't sell until the price reaches HKD 48.98, aiming to surpass previous highs.
Third, some investors believe that as a leading company with strong profitability, the decline in Zijin Mining's share price does not mean its fundamentals have been completely negated. Instead, it may indicate an overreaction of market sentiment.
However, there is an issue with this kind of bullish sentiment: much of the commentary reflects holding beliefs rather than signs of short-term strength. After the stock fell to 34.420 yuan, it is indeed approaching the lower Bollinger Band, and with the RSI being low, there are technical conditions for a short-term rebound. But without sufficient trading volume and failing to break back above the pivotal level around 36 yuan, such a rebound could easily be a weak pullback rather than a return to strength. For short-term trading, the attitudes of “not selling” and “still optimistic” represent holding positions but cannot replace confirmation of a bottom.
Bearish comments reflect more direct sentiment. Some investors think the stock price won’t hold up for long and may even drop into the 20-yuan range. Others repeatedly mention the short-selling target of 27 yuan, believing the decline isn’t over yet. Other investors express disappointment that the gains from the past month have been erased, even describing the movement as exaggerated, reflecting a significant hit to short-term confidence. These bearish comments may not all be fully supported by current technical data, but they do indicate that the market sentiment toward Zijin Mining’s short-term performance has shifted from optimism to anxiety, especially as upward pressure from chasing-high funds rises.
From a technical perspective, Zijin Mining’s real issue now is that the stock price has fallen below several key moving averages. The 10-day, 20-day, and 30-day moving averages are all above the current price of HKD 34.420, with the 20-day and 30-day moving averages concentrated around HKD 36.88, forming a significant resistance zone. This means that even if there is a short-term rebound, the level near HKD 36 will not be easily broken through. Only by reclaiming the pivotal level near HKD 36 can the short-term structure have a chance to recover. If the rebound stalls between HKD 35.160 and HKD 36, it would still be a weak rebound.
On the support side, 33.520 yuan is the first key level. At the current price of 34.420 yuan, this support is not far away, and the market will likely test this area's resilience soon. If 33.520 yuan holds firm, combined with the Relative Strength Index (RSI) nearing oversold levels, the stock could see a technical rebound, initially targeting resistance at 35.160 yuan, followed by the pivotal 36 yuan mark. However, if 33.520 yuan is breached, market sentiment will weaken further, and the next significant support will be around 31.660 yuan. This also explains why some investors mention strong support at 31 yuan, as from a technical standpoint, 31.660 yuan is indeed the next crucial support level to watch.
The core issue reflected in the comments is that retail investors are starting to question whether they should trust long-term value or follow short-term trends to exit. Some ask if large funds are bottom-fishing today, others believe there will be strong support at 31 yuan, while some admit they cannot figure out this stock. This mindset is typical: after a sharp drop, long-term investors think it’s cheap, short-term traders see poor momentum, and those holding the stock are caught between the two. The easiest mistake to make now is conflating long-term optimism with a short-term bottom. Long-term optimism might exist, but whether it’s worth adding positions in the short term still depends on support levels and the strength of any rebound.
Volume analysis remains cautious. During the recent decline, trading volume hasn’t significantly contracted, indicating continued selling pressure in the market. If trading volume doesn’t shrink during price declines, it means the selloff isn’t being ignored—some investors are still reducing holdings or rotating out. Meanwhile, during rebounds, trading volume hasn’t notably increased, showing that upward moves lack sufficient capital inflow. This kind of volume pattern is not ideal in the short term because true strong recovery typically requires higher trading volume during rebounds, rather than seeing volume on declines but no power in bounces.
Therefore, Zijin Mining currently offers relatively low investment appeal. While there are conditions for a short-term rebound, as the current price of HKD 34.420 is close to the lower Bollinger Band and the Relative Strength Index (RSI) is nearing oversold territory, a technical rebound could occur at any time. However, the stock price has already breached multiple moving averages, and heavy resistance exists near HKD 36, without clear signs of recovery in trading volume. Therefore, it is still premature to conclude that the downtrend has ended. The most reasonable short-term assessment is to first observe whether HKD 33.520 can hold. If it holds, there may be opportunities for a rebound to test HKD 35.160 and HKD 36; if it doesn't, further downside towards HKD 31.660 should be anticipated.
Overall, Zijin Mining still has room for value discussions, but its short-term trend is undeniably weak. Long-term investors can continue to focus on the company’s leading position and profitability, but short-term traders must respect the charts. The 33.520 yuan level serves as the first line of defense, 31.660 yuan as the next support, and the area near 36 yuan as the pivotal point for recovery. Until the price breaks back above 36 yuan, all rebounds should be treated as weak pullbacks for now. If the price manages to hold above 33.520 yuan and rebounds with higher volume, market confidence could start to recover. However, if it breaks below 33.520 yuan, the much-talked-about 31 yuan support among retail investors will become the next major battleground.
Latest update (May 19 morning):
Zijin Mining is currently trading at HKD 33.2, down approximately 3.54%, having broken below the key support level of HKD 33.520. This indicates that the resources sector as a whole remains weak, and after Zijin Mining lost its key support, market sentiment has turned more bearish. The next support level to watch is around HKD 31.66. If today’s (May 19) closing price fails to reclaim HKD 33.52, the short-term bearish pattern will be further confirmed.
Reply to some investors' views:
@午夜交易员If large funds were used to buy the dip on Friday, we should subsequently see stabilization and improved trading volume around the HKD 33.520 level. For now, observation is warranted, but strength cannot be confirmed until the price breaks above HKD 36.
@溫文爾雅的克萊門特: The current price is close to the lower Bollinger Band. From this position, it appears attractive for bargain hunting, but in the short term, one must still guard against a breakdown below 33.520 yuan.
@跑不贏指數: There could be thoughts of bottom fishing, but it's best to wait until 33.520 yuan holds steady; otherwise, if it breaks down, it may test 31.660 yuan next.
Based on the above analysis, the strategies for deployment can be divided into the following main approaches:
Key Deployment: Zijin Mining's current price is 34.420 yuan. In the short term, focus on whether support at 33.520 yuan can hold. If it holds, only observe a weak rebound. If 33.520 yuan is breached, the risk of testing 31.660 yuan increases. Only by breaking back above the pivotal level near 36 yuan will the trend have a chance to recover.
Strategy One | Turning bearish after breaking below 33.520 yuan
$UBZIJIN@EP2607A.P (25237.HK)$ | Strike Price 28.97 yuan | Actual Leverage 7.9 times | Higher leverage, suitable for following bearish momentum after the stock price breaches 33.520 yuan; the key is capturing the accelerated downward move towards support at 31.660 yuan.
$MSZIJIN@EP2607A.P (25188.HK)$ | Strike Price 28.97 yuan | Actual Leverage 8.0 times | Maximum flexibility, suitable for aggressive bearish strategies; use case involves continuous selling pressure after breaking support, requiring quicker response in the short term.
$HUZIJIN@EP2610A.P (24795.HK)$ | Strike Price 29.90 yuan | Actual Leverage 4.3 times | Moderate leverage, strike price closer to the lower support zone, suitable for bearish positions that aim to avoid excessive volatility.
For more market analysis, stay tuned to Jenny's daily updates on 'Hong Kong Stock Warrants'!
Reminder: This article does not constitute any investment advice.
This article is for reference only and does not constitute any investment advice. Market data, opinions, and analysis contained herein may change at any time without prior notice. We are not responsible for any loss or damage caused by reliance on the information in this article. Technical analysis only shows whether certain technical conditions are met; asset performance should be comprehensively evaluated using other sources of information, and trading decisions should not be made solely based on this article. Please note that past performance is not indicative of future results.
#HKStocks #Zijin #Real-TimeAnalysis #WarrantPick #WarrantGuide #DerivativesHedging #HKWarrantsJenny #Blue-ChipStocks #TechnicalAnalysis
Risk Disclaimer: The above content only represents the author's view. It does not represent any position or investment advice of Futu. Futu makes no representation or warranty.Read more

Comment (1)
to post a comment
1
1