
PDD Holdings reported Q1 revenue of RMB 106.2 billion—has its share price already hit bottom?
Hua Hong Semiconductor's short-term trend has fallen below the 10-day line; a pullback needs to hold above the key support at 103 yuan.
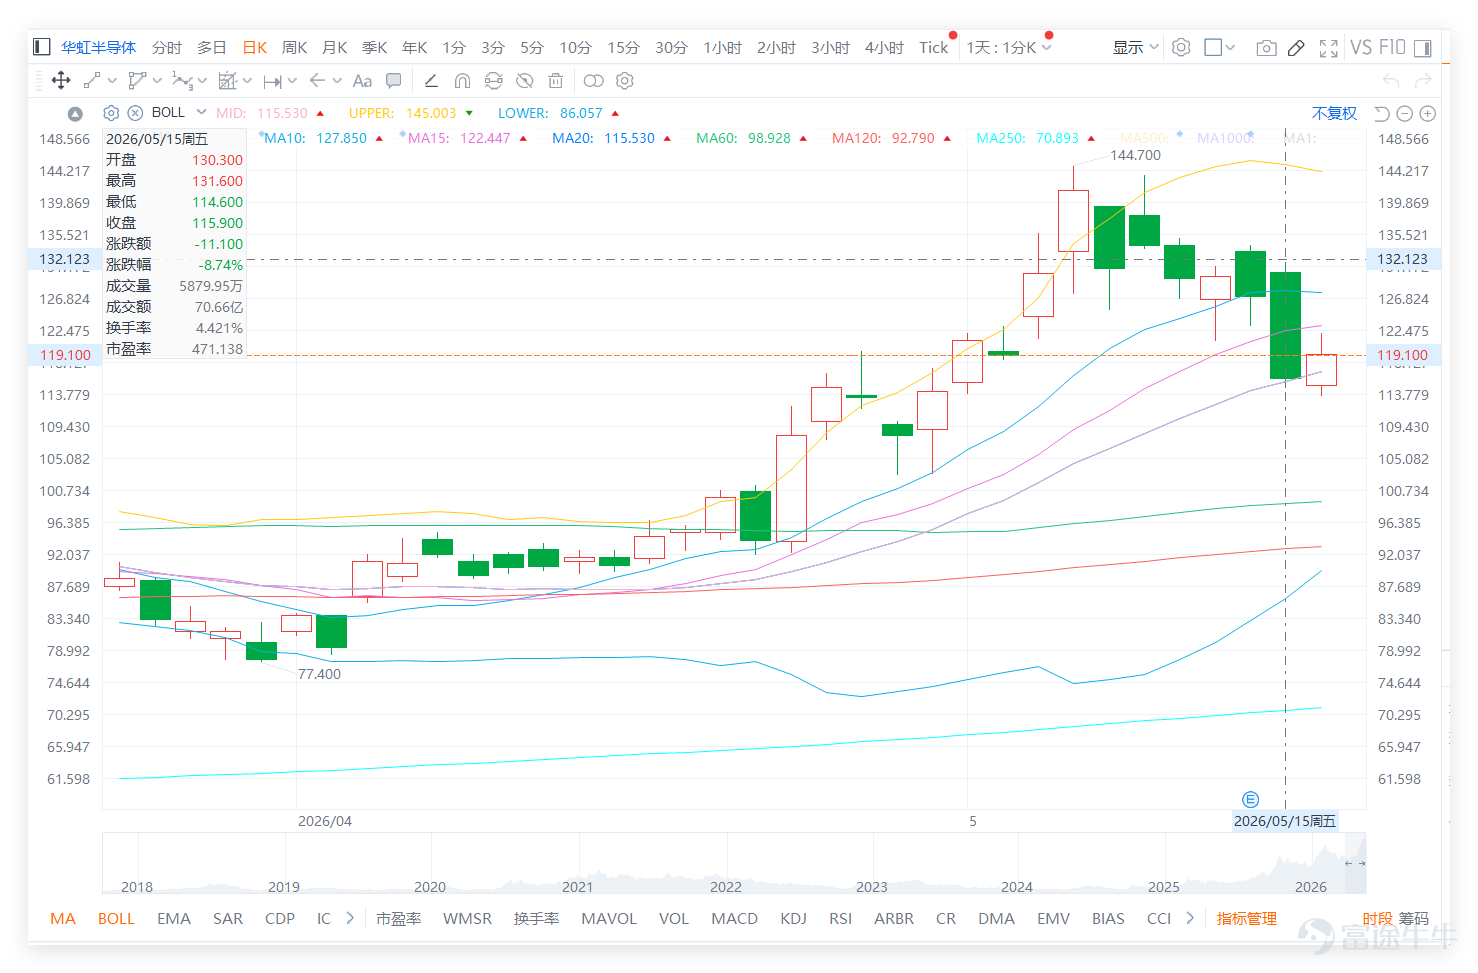
Last Friday (May 15th) $HUA HONG GRACE (01347.HK)$
The closing price was 115.9 yuan, with a relatively large single-day adjustment. This morning (May 18), the share price rebounded to around 117 yuan.
From a technical data perspective, the current market situation is at a critical technical equilibrium point.
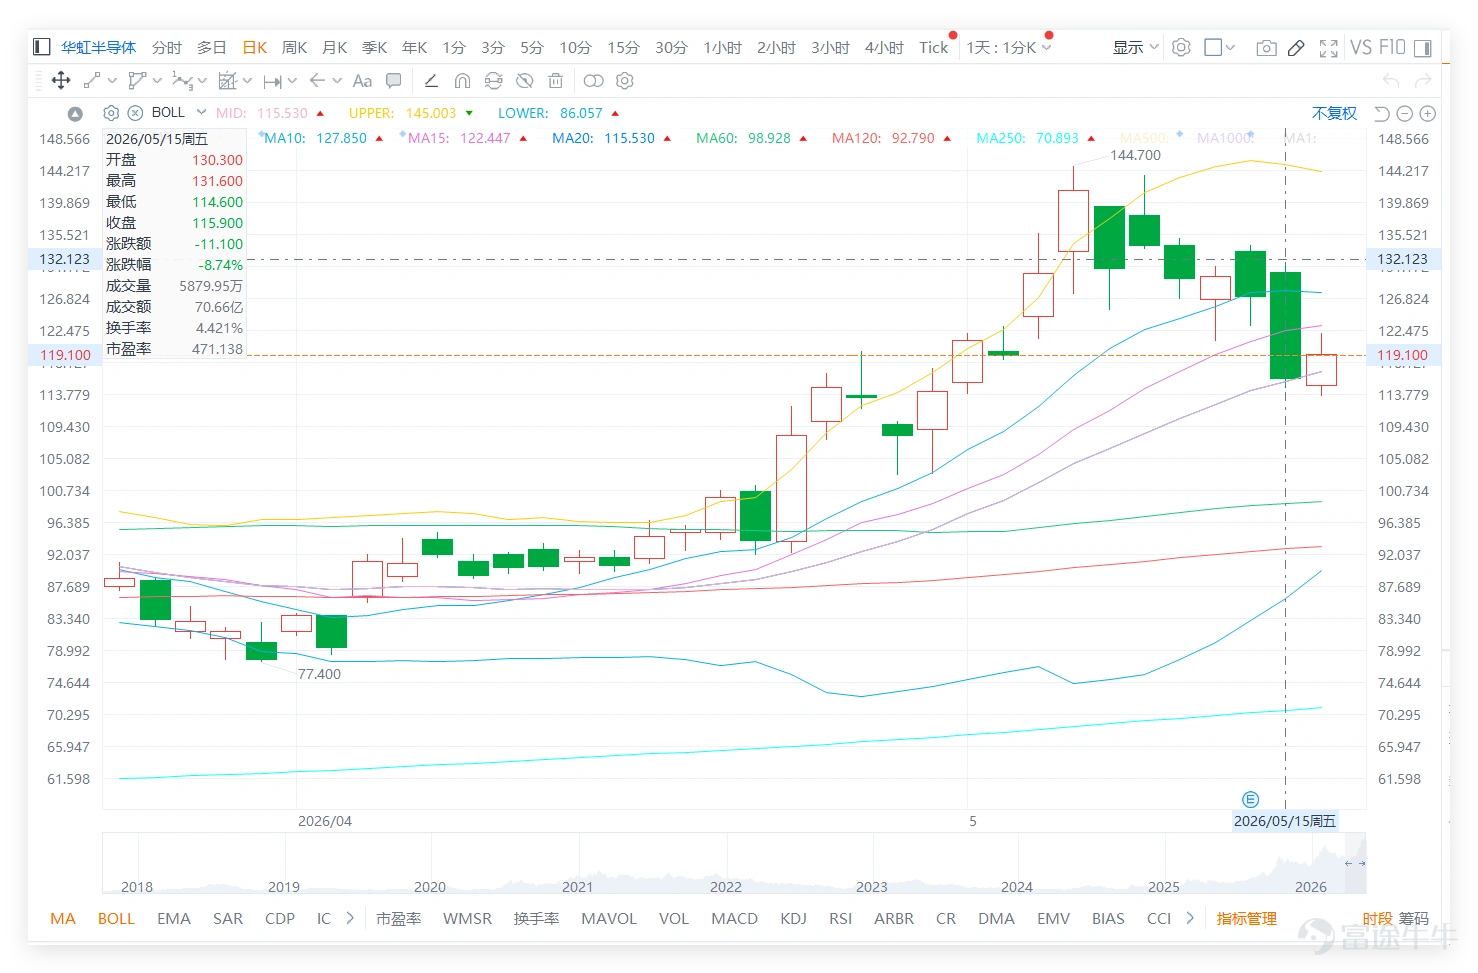
Key Price Level Battle: The most important near-term support on the chart is at 103 yuan (Support 1), which is crucial for maintaining the short-term structure. A stronger support lies below at 90 yuan (Support 2). The first resistance above is at 136.8 yuan (Resistance 1), and a breakout would open up more room. Currently, the stock price is oscillating widely between support and resistance.
Moving Average System Analysis: The closing price from the previous day (115.9) has retreated below the 10-day moving average (127.85), indicating weakening short-term momentum and facing some pressure. However, the stock price remains significantly above the 30-day (106.21) and 60-day moving averages (98.93), showing that the foundation of the medium- to long-term uptrend has not been broken. The current pullback can be seen as a retest towards the medium- to long-term moving averages.
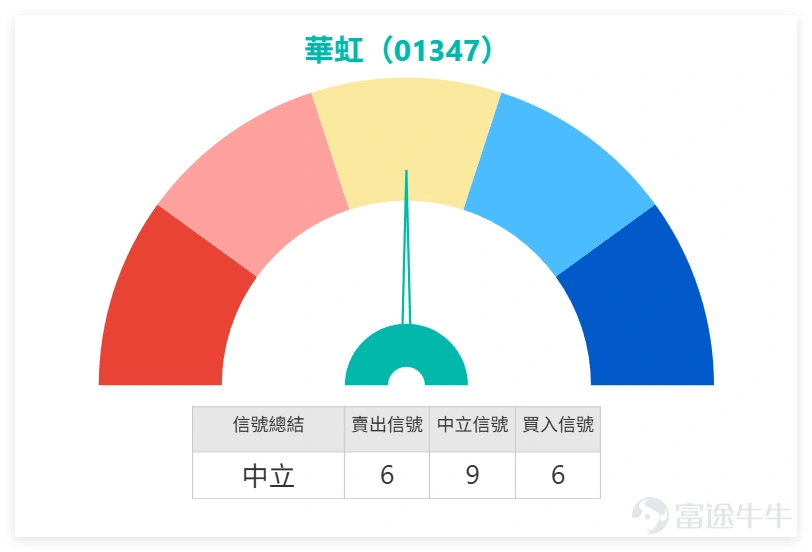
Momentum Indicator Interpretation: The RSI is at 55, which is a typical neutral zone value, indicating that the balance of power between bulls and bears is currently even, with neither significant overbought nor oversold pressure. The technical indicators summarize a "neutral" signal, consistent with the RSI message. Notably, the MACD indicator gives a "buy" signal, which may suggest that the potential direction of medium-term momentum still leans positive, but requires confirmation from price movement.
Overall, after substantial fluctuations, the stock price is seeking a new equilibrium between short-term pressure and medium-term support. The 103-yuan level is a key technical threshold that needs to be defended in the near term.
Among the entire semiconductor sector, Huahong's technical signals (neutral) appear slightly cautious compared to the industry leader SMIC ( $SMIC (00981.HK)$ , with a technical signal of 'buy'). This might reflect that market capital has different focuses and rhythm assessments within the sector for individual stocks. Investors may consider peer performance as one reference point for overall industry sentiment.
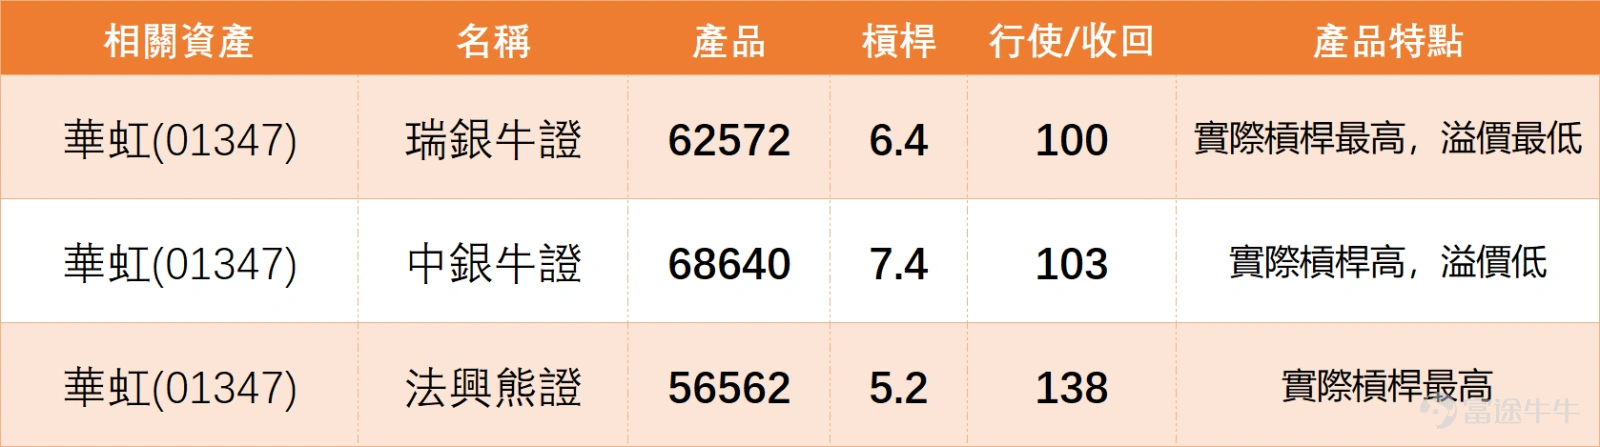
Reference for warrant product strategies:
With the stock price near a key support level and neutral technical signals, derivative product deployment requires greater attention to risk control and timing selection. Below are analyses of two selected products with different characteristics; these are not buy or sell recommendations:
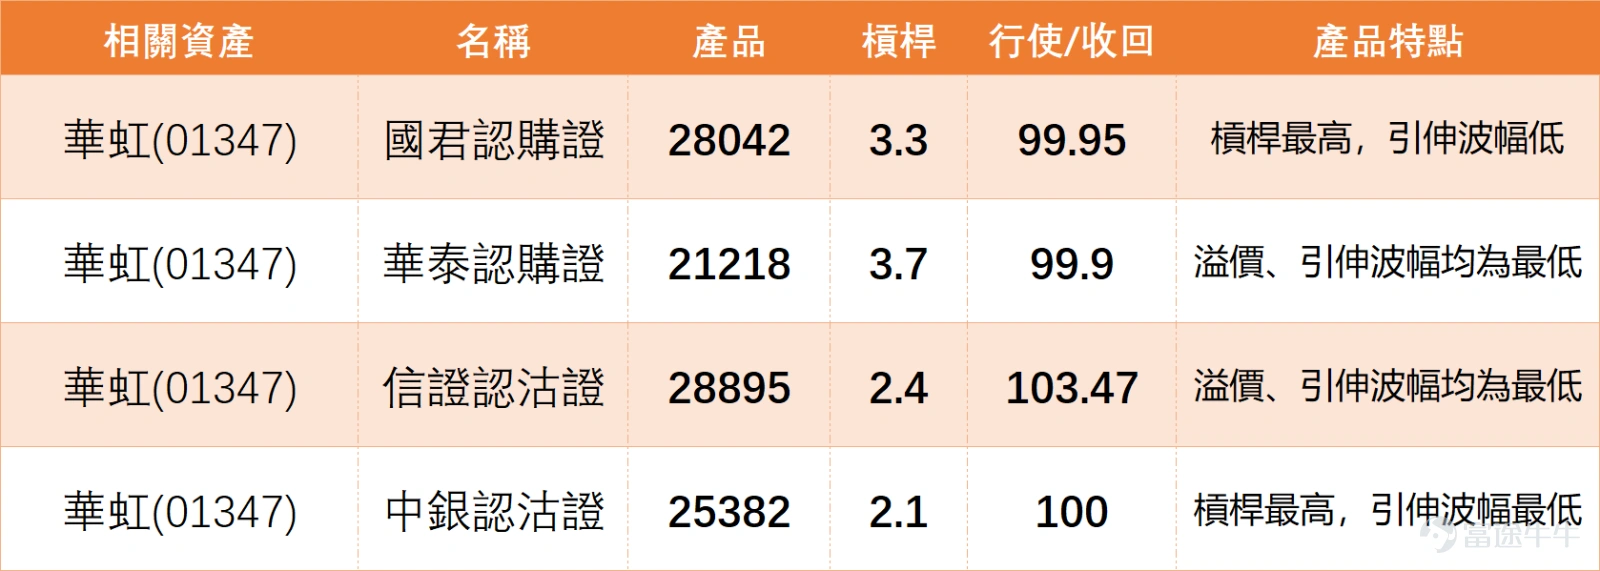
1. Bullish strategy: If you believe the stock price can stabilize and rebound at the 103-yuan support level, you can focus on high-leverage call warrants with low implied volatility, such as $GJHUAHO@EC2608C.C (28042.HK)$ . Their characteristic is significant potential volatility elasticity.
2. Bearish or hedging strategy: If you judge that the stock price may test the key support, you can pay attention to put warrants with the lowest premium and implied volatility, such as $CIHUAHO@EP2611B.P (28895.HK)$ Its position cost-related parameters have an advantage.
Please be sure to note that callable bull/bear contracts (CBBCs) are subject to a mandatory recall mechanism. All derivative instruments carry extremely high risks, and investors must fully understand the terms and strictly manage risks before investing.
For more market analysis, stay tuned to Jenny's daily updates on 'Hong Kong Stock Warrants'!
Reminder: This article does not constitute any investment advice.
This article is for reference only and does not constitute any investment advice. Market data, opinions, and analysis contained herein may change at any time without prior notice. We are not responsible for any loss or damage caused by reliance on the information in this article. Technical analysis only shows whether certain technical conditions are met; asset performance should be comprehensively evaluated using other sources of information, and trading decisions should not be made solely based on this article. Please note that past performance is not indicative of future results.
#HKStocks #HuaHong #Real-TimeAnalysis #WarrantPick #WarrantGuide #DerivativesHedging #HKWarrantJenny #Blue-ChipStocks #TechnicalAnalysis
Risk Disclaimer: The above content only represents the author's view. It does not represent any position or investment advice of Futu. Futu makes no representation or warranty.Read more

Comments
to post a comment
1