

PDD Holdings reported Q1 revenue of RMB 106.2 billion—has its share price already hit bottom?
May 15th [HK Stocks Podcast] Part 2 - Tencent, Lens Technology, Wuxi Bio
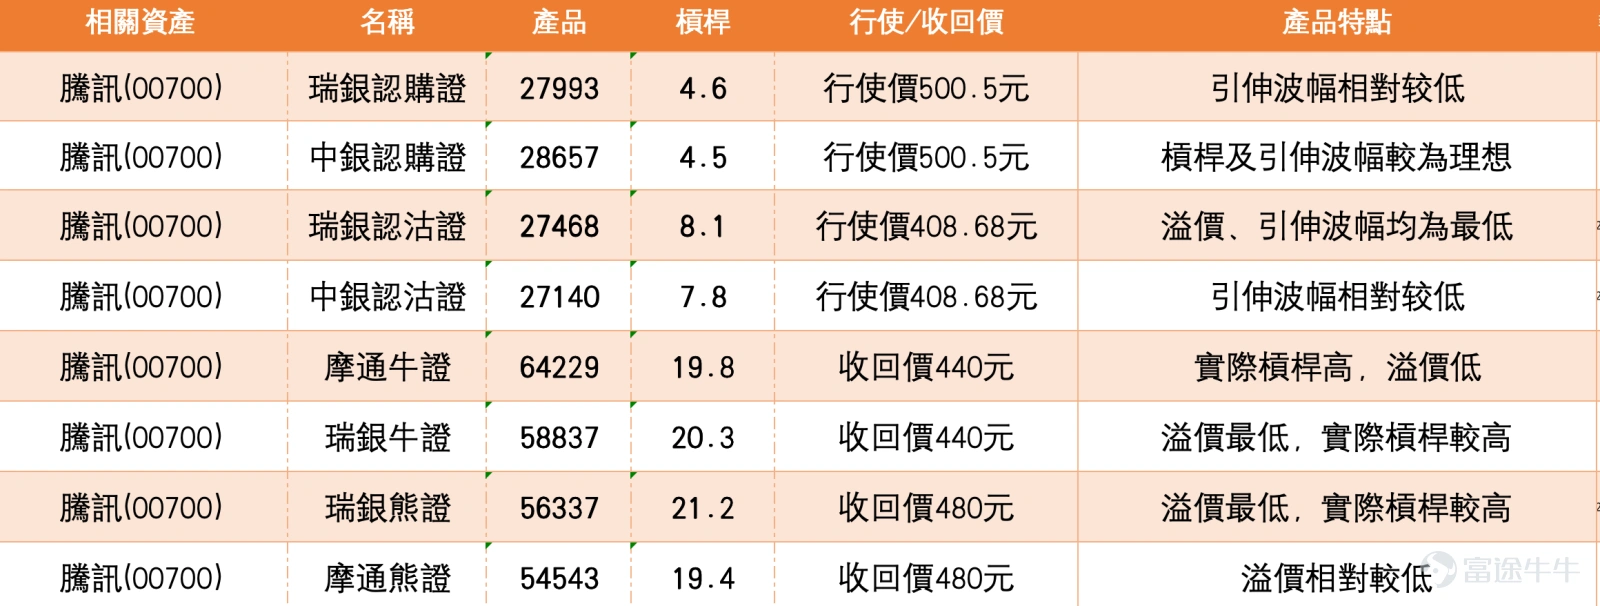
4. Tencent remains weak in the short term; the bull certificate at 440 yuan faces testing risks, and call warrants need a breakout to become attractive.
Tencent closed at 456.400 yuan, up 1.500 yuan or 0.33%, but overall, it is still in a weak rebound pattern. The stock price remains below the 10-day moving average at 461.010 yuan, the 20-day moving average at 475.055 yuan, and the 30-day moving average at 481.270 yuan, indicating that the short-term trend has not yet recovered. The middle Bollinger Band axis is at 475.055 yuan, the upper band at 514.308 yuan, and the lower band at 435.802 yuan; the current price is still below the middle axis, with insufficient rebound momentum.
Investors are asking whether bull certificates around the 440 yuan level will be hit next week. From the chart perspective, this risk cannot be ruled out. Tencent’s recent low was at 448.700 yuan, and with the current price at 456.400 yuan, it is not far from 448.700 yuan. The lower Bollinger Band sits at 435.802 yuan, indicating that if the stock price falls below the 450 yuan area again, the market could easily retest 448.700 yuan or even move closer to the 440 yuan region. Therefore, bull certificates near 440 yuan are not completely safe. Investors holding certificates close to the forced redemption price should manage their risks carefully.
As for investors who remain bullish and hold call warrants with a strike price of 629.38 yuan, they must note that the gap between the current stock price and the strike price is substantial, and the underlying stock remains below key moving averages. Unless Tencent first breaks above 461.010 yuan and then rises back above 475.055 yuan, the short-term attractiveness of the call warrants will remain low. A true improvement signal would be when the stock price regains the 20-day moving average at 475.055 yuan—otherwise, this is just a rebound within a weak trend, and excessive optimism should be avoided.
Overall, Tencent's downside support to watch first is at 448.700 yuan. If that level is broken, the likelihood of bull certificates in the 440 yuan region being tested will increase. On the upside, the initial resistance to watch is 461.010 yuan, followed by 475.055 yuan. For short-term strategies, bull certificate holders should not consider the 440 yuan region as absolutely safe, and call warrant holders should not rely solely on bullish sentiment to hold their positions. They should wait until the stock price moves above key moving averages before the attractiveness improves significantly. $BITENCT@EC2706A.C (28657.HK)$$UB#TENCTRC2607U.C (58837.HK)$$JP#TENCTRP2810O.P (54543.HK)$
5. Lens Technology shows clear short-term strength, but the target of 30 yuan still needs confirmation through a breakout.
Lens Technology closed at 21.920 yuan, up 1.090 yuan or 5.23%, showing clear short-term strength. The stock price has broken above the 10-day moving average at 19.387 yuan, the 20-day moving average at 18.104 yuan, and the 30-day moving average at 18.506 yuan, reflecting that the previous weakness has been repaired, with short-term capital flowing back in. The middle Bollinger Band axis is at 18.104 yuan, the upper band at 21.871 yuan, and the lower band at 14.337 yuan; the current price has risen near and slightly above the upper band, indicating accelerating upward momentum but also approaching an overheated short-term zone.
Investors mentioned that they want to see at least 30 yuan, which is an aggressive target. From the current chart, Lens Technology has rebounded from a low of 15.170 yuan to 21.920 yuan, already reflecting significant gains and clear improvement in short-term momentum. However, to challenge 30 yuan, the stock price needs to stabilize above the upper Bollinger Band at 21.871 yuan and digest short-term profit-taking pressure. If it only briefly breaks above the upper band and then retreats, the trend may consolidate at higher levels rather than immediately surge to 30 yuan.
For investors holding call warrants with an exercise price of 26.13 yuan, the current price of 21.920 yuan is still some distance from the exercise price, but compared to the earlier weak phase, the attractiveness of the call warrants has improved. The key lies in whether the underlying stock can maintain its breakout trend; if the stock price continues to hold above 21 yuan to 21.871 yuan, the call warrants can benefit from short-term strength; however, if it falls back below the upper rail and breaks down near 20 yuan, caution is needed as upward momentum may cool.
Overall, Lens Technology is showing short-term strength, with the rebound from lower levels having transformed into a more pronounced upward movement. The focus will be on whether it can stabilize above 21.871 yuan, then gradually observe if there's enough momentum to extend to higher levels; downside support lies at 20 yuan and 19.387 yuan for short-term defense. The target of 30 yuan is not entirely unimaginable, but at this stage, it remains an ambitious goal requiring the stock price to consistently stay above the upper rail with strong trading volume support.
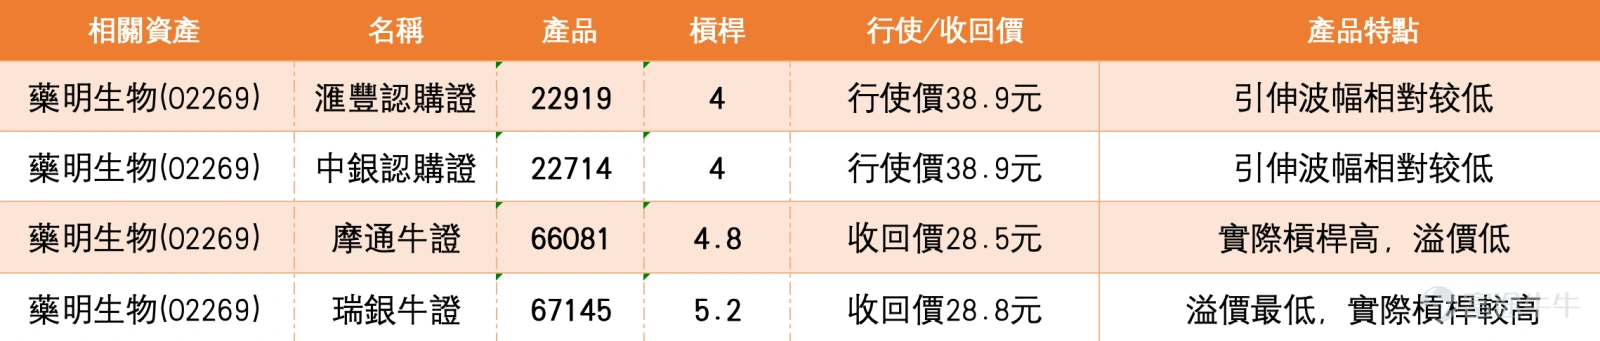
6. Wuxi Bio's short-term rebound has yet to confirm a breakout; a 40-yuan target requires breaking through channel resistance first.
Wuxi Bio closed at 33.680 yuan, up 1.040 yuan or 3.19%, rebounding today, but overall still within range-bound recovery. The current price is above the 10-day moving average of 33.426 yuan, but slightly below the 20-day moving average of 33.864 yuan and the 30-day moving average of 34.448 yuan, reflecting improved short-term momentum but without fully reversing overhead pressure. The middle Bollinger Band is at 33.864 yuan, the upper rail at 35.665 yuan, and the lower rail at 32.063 yuan; the current price is still struggling near the middle band, not yet a confirmed breakout.
Investors believe that if the stock can break through the channel resistance, there is potential to challenge the 40-yuan mark, with the key being the upper rail at 35.665 yuan. If the stock price rises above 33.864 yuan and 34.448 yuan, followed by a further breakout above 35.665 yuan, the rebound structure would shift from a weak recovery to a more definitive upward attack, making the 40-yuan target more achievable. Conversely, if the stock fails to stabilize above the middle band and the 30-day line, the rebound may remain within range-bound fluctuations.
For investors holding call warrants with an exercise price of 38.9 yuan, the current price of 33.680 yuan is still some distance away from 38.9 yuan, thus requiring continued upward movement of the underlying stock for better odds. If the stock price only consolidates around 33 yuan to 34 yuan, time decay pressure on the call warrants will become more apparent; if it successfully breaks through 35.665 yuan, warrant positioning will become more favorable.
Overall, Wuxi Bio is still in the early stages of a rebound and has not yet confirmed a full recovery. In the short term, resistances to watch are at 33.864 yuan and 34.448 yuan, with the key resistance at 35.665 yuan. Support lies at 32.063 yuan. The target of 40 yuan can be retained for observation, but for now, investors should wait for the stock price to break through channel resistance before viewing the rebound as a renewed uptrend. $BI-WUXI@EC2611A.C (22714.HK)$$JP#WUXI RC2607D.C (66081.HK)$$UB#WUXI RC2607E.C (67145.HK)$
Reminder: This article does not constitute any investment advice.
This article is for reference only and does not constitute any investment advice. The market data, views, and analysis contained herein may change at any time without prior notice. We are not responsible for any loss or damage caused by reliance on the information in this article. Technical analysis only shows whether certain technical conditions are met; asset performance should be comprehensively evaluated with other data. Trading decisions should not be made solely based on this article. Please note that past performance is not indicative of future results. Follow Jenny's HK Stock Warrants for more professional insights.
Risk Disclaimer: The above content only represents the author's view. It does not represent any position or investment advice of Futu. Futu makes no representation or warranty.Read more

Comment (1)
to post a comment
1