
AI Boom vs. Tight Liquidity: Will the US Stock Rally Continue?
The resurgence of US Treasury yields: Is it necessarily bearish for US stocks?
Author: Yu Shilin ATQ882 | May 15, 2026
The auction rate for the 30-year US Treasury bonds surpassed 5.0% for the first time since the 2007 financial crisis, driven by factors including an energy shock that raised inflation expectations—WTI crude oil remained near $102/barrel on May 14—and a significant delay in interest rate cut expectations within the year. Fiscal and supply pressures have also pushed term premiums higher again; federal budget deficit/GDP is projected to be around 5.2% in 2026, with some studies predicting it could rise to 6.3%.
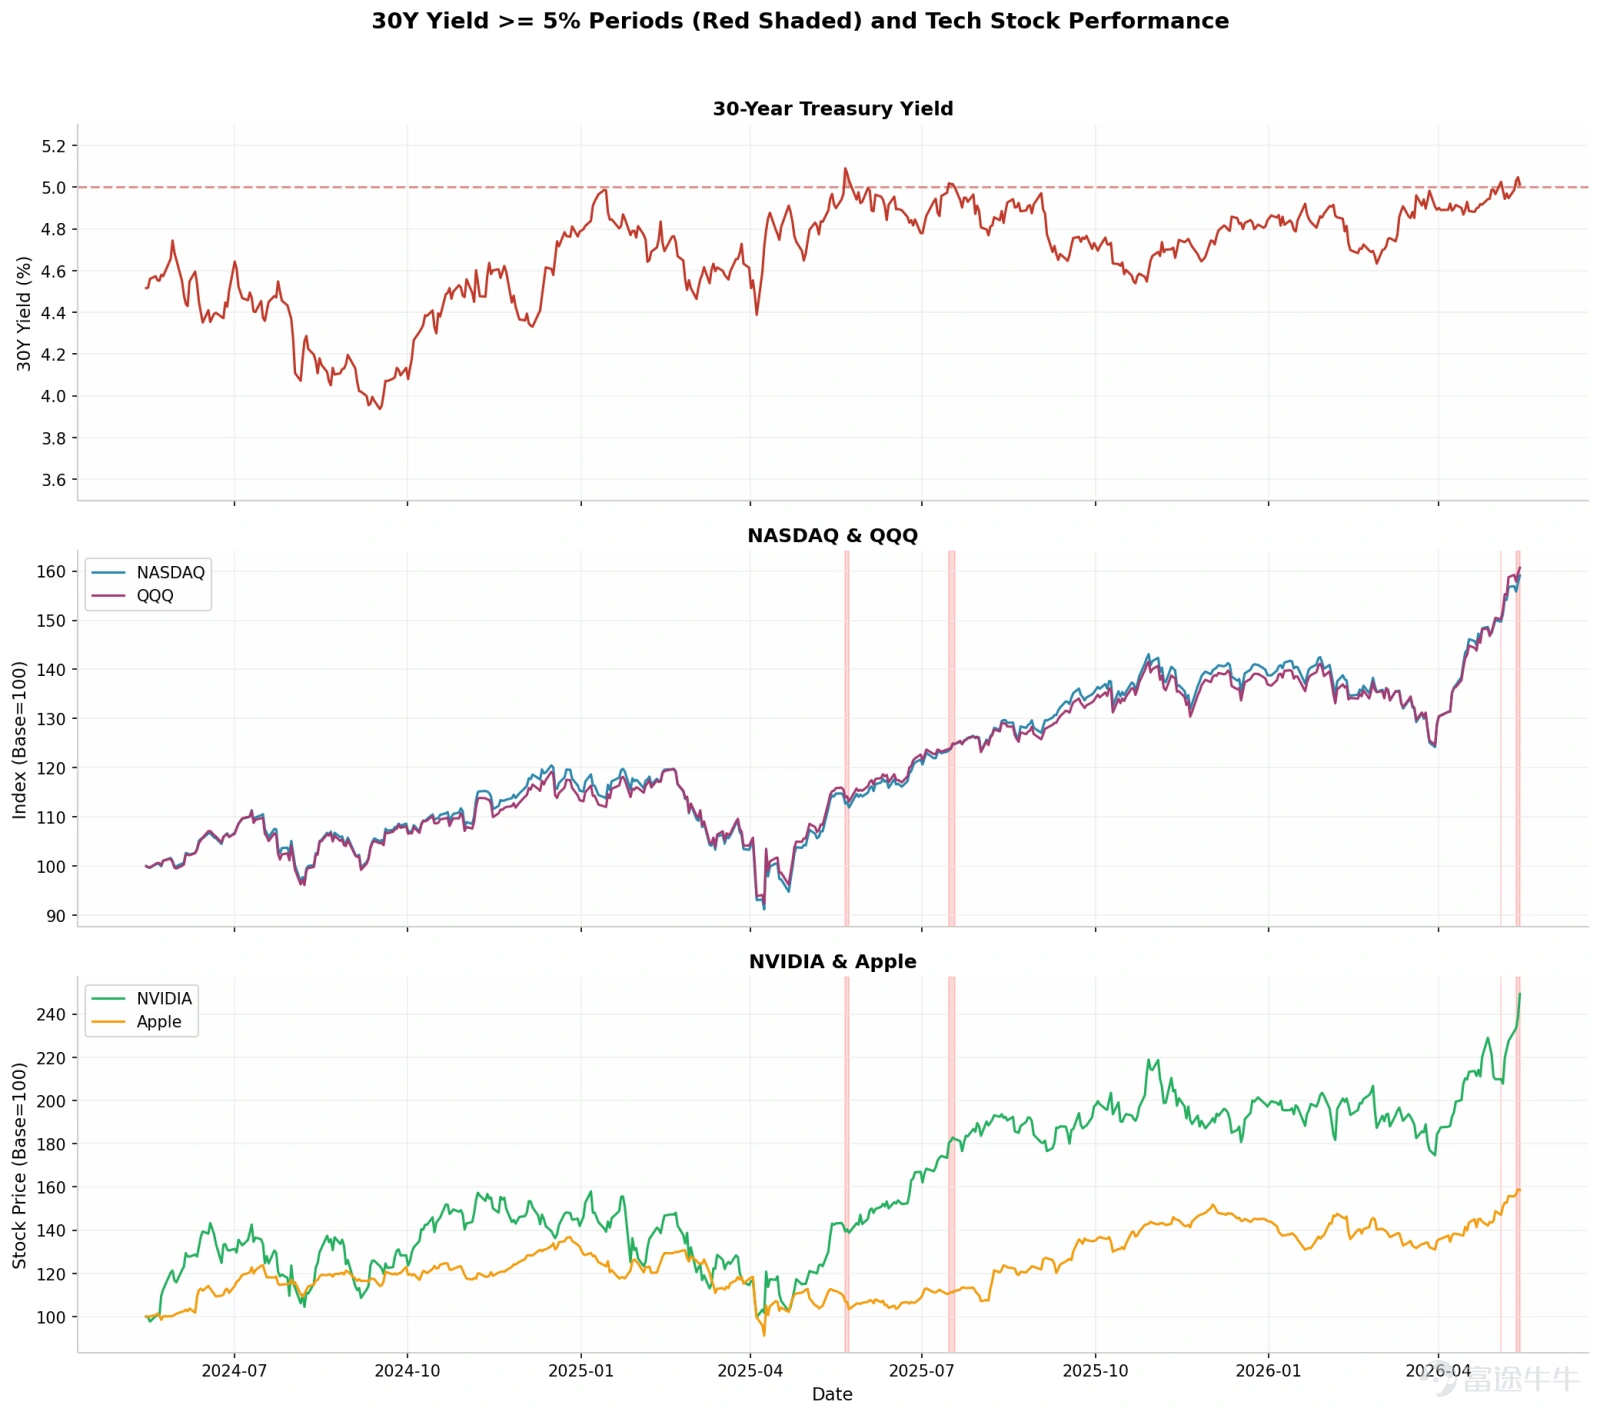
The current rise in long-term interest rates has reignited market concerns about inflation, fiscal issues, supply pressures, and rising term premiums. On May 15, the US30Y yield hit 5.086, pressuring tech stocks pre-market. The narrative that high yields (above 5%) are bearish for equities has resurfaced. Let’s break this down.
I. Long-Term Perspective
Based on annual data from 1977 to 2024, there were 28 years when yields were ≥ 5%, accounting for 57% of the total 49 years. Whether yields were above 5% did not significantly negatively affect NASDAQ or the S&P 500. For example, during the tech boom from 1995–1999, the stock market achieved remarkable gains instead.
In the 28 years where yields were ≥ 5%, NASDAQ recorded negative returns in only 8 years (29%), and these negative-return years were almost always associated with specific economic crises:
- 1977 (Stagflation)
- 1984 (Latin American Debt Crisis)
- 1990 (Gulf War)
- 1994 (Bond Market Massacre)
- 2000–2002 (Dot-com Bubble Burst)
- 2008 (Financial Tsunami)
From a long-term perspective, what hits the stock market is not just the high dividend yield as a single factor, but it requires an accompanying economic recession or financial crisis.
2. Medium to long-term perspective
Between 2016 and 2026, there were 12 significant local peaks in the 30-year bond yield reaching or exceeding 4.5%. These peaks were concentrated from late 2023 to early 2026, reflecting structural upward shifts in long-term rates driven by post-COVID inflation, Fed tightening, and expanding fiscal deficits. The 12 peaks are divided into three intervals based on yield levels, and the subsequent average returns within each interval are calculated.
The research methodology is as follows:Identify all 'local peaks' (defined as the highest points within 15 trading days before and after) of the 30-year bond yield over the past decade, screen out peaks with yields ≥ 4.5%, and calculate the subsequent index returns for each peak at 1 month (21 trading days), 3 months (63 trading days), 6 months (126 trading days), and 12 months (252 trading days). Divide the 12 peaks into three intervals based on yield levels:
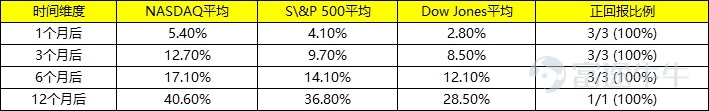
Yield ≥ 5.0% interval(3 peaks: October 2023, May 2025, July 2025)
All peaks where yields broke through 5% over the past decade saw positive stock market returns after 1 month, 3 months, and 6 months.
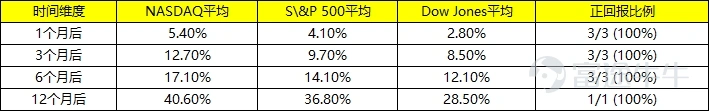
Yield 4.8%–5.0% interval(6 peaks)
When the yield approaches 5% but does not break through, the subsequent returns are even slightly higher than when it breaks through 5%. The only exception was the peak on January 14, 2025 (yield at 4.98%), when the NASDAQ fell by 11.7% three months later – this was exactly the market correction triggered by tariff fears at the beginning of 2025, a special event-driven scenario unrelated to interest rates themselves.

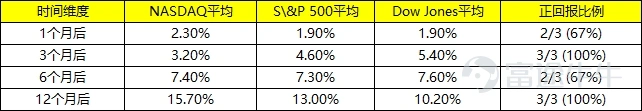
Yield range of 4.5%–4.8%(3 peaks in 2024)
As the yield moves further away from 5%, the magnitude of subsequent returns also decreases. The average return 12 months after yields are in the 4.5%–4.8% range is approximately 15–16%, which, while still positive, is significantly lower than the 30–40% seen when yields are closer to 5%.
Data over the past decade shows that as yields approach 5%, markets price in scenarios more fully. When yields are in the 4.5%–4.8% range, the market is still digesting the impact of rising interest rates, and returns are relatively moderate (average +13–16% after 12 months). However, when yields approach or exceed 5%, the market has already priced in the worst-case scenario, and any outcome below expectations (such as the Fed pausing rate hikes, inflation cooling, or a soft economic landing) becomes a positive catalyst, driving a strong stock market rebound.
The biggest difference between the data from the last decade and historical data from the 1970s to 2000s lies in the structural driving force of the AI revolution.When structural growth trends are strong enough, they can offset the negative impact of interest rate factors. This is why, despite yields repeatedly approaching 5% between 2023 and 2025, the stock market continued to hit new highs.
Third, a 24-month perspective
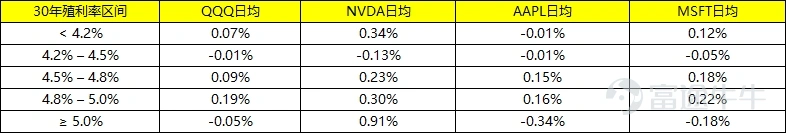
Daily data from May 2024 to May 2026 show that the 30-year bond yield went through multiple tests of the 5% threshold during this period. Dividing the trading days over these two years into five intervals based on yield levels, we observe the average daily returns of the three major U.S. stock indexes within each interval:
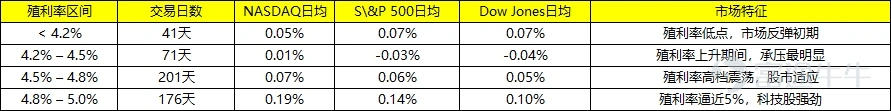
The 30-year bond yield range of 4.8%–5.0% covered most of the second half of 2025 to early 2026. During this time, the market experienced several important turning points: a temporary ceasefire in the U.S.-China trade war, continued strong demand for AI, and dovish/neutral signals from the Fed. These factors drove a recovery in risk appetite, offsetting the negative impact of high yields.
The level of dividend yield alone cannot effectively predict short-term stock market trends. Although the E/P ratio (Earnings Yield, or the inverse of the P/E ratio) has a positive relationship with bond yields in the long term, the explanatory power of this relationship is only about 35%, and it varies significantly across different historical periods.
If the rise in yields is due toa strong economy(such as in the 1990s or 2024), corporate earnings growth can offset valuation compression;
on the other hand, if the rise in yields is due touncontrolled inflation or a debt crisis(such as in the 1970s), stock markets tend to perform poorly.
The current rise in yields reflects more the expansion of fiscal deficits, the rise in term premiums, and the phase-wise high in energy prices, rather than economic overheating. Moreover, when yields consolidate within the 4.5%-5% range for more than 200 trading days, the market has already fully priced in interest rate expectations. At this point, unless yields break higher (e.g., to 5.5% or 6%), 5% itself no longer constitutes a major negative factor.
The speed of interest rate changes is more important than the absolute level:When the yield surged rapidly from 1.5% to 4% in 2022, the NASDAQ plummeted by 33%; however, when yields consolidated in the 4.5%-5% range, the stock market adapted and moved higher instead. The market's panic over 5% is more psychological than based on rigorous valuation models. When yields hit 5%, the market began betting that the Fed would be forced to ease policy, and this expectation itself became a driving force for the stock market rally.
4. Tech Stocks' Sensitivity to Interest Rates
In theory, growth stocks are indeed more sensitive to changes in long-term interest rates than value stocks, while value stocks are more sensitive to short-term rates and corporate bond spreads. However, actual market performance: Over the past decade, value stocks have consistently underperformed growth stocks — the reasons beingThe four factors of inflation, real interest rates, corporate earnings growth rate, and stock market volatility jointly drive the market, with interest rates being only one dimension.
Individual stock performance:
$NVIDIA (NVDA.US)$ : During the 11 trading days when yields were ≥ 5%, it rose an average of 0.91% per day, mainly due to the explosion of AI demand in May 2025 and positive earnings reports,Almost unrelated to interest rates. This shows that when structural growth trends are strong enough, they can completely offset the negative impact of interest rate factors.
$Apple (AAPL.US)$ : It fell an average of 0.34% per day when yields were ≥ 5%, which is consistent with theoretical expectations because Apple's growth rate has shifted to a moderate pace, making it more sensitive to changes in discount rates.。
$Invesco QQQ Trust (QQQ.US)$ : The strongest performance occurred in the 4.8%-5% range (+0.19%/day), indicating that when yields approach but do not exceed 5%, it is actually most beneficial for tech stocks, reflectingWhen the market has fully anticipated and priced in a 5% yield, any outcome below the worst-case scenario becomes a positive surprise.
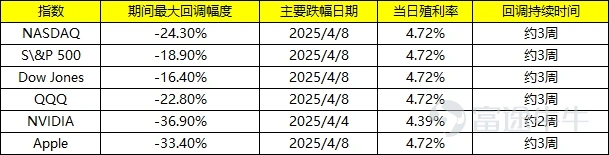
The largest actual drawdown in US stocks over the past two years occurred during the tariff shock in April 2025, with the biggest pullback happening when yields were only at 4.39%-4.72%. The decline was primarily driven by fears of a recession triggered by the Trump administration’s tariff policies rather than interest rates themselves. At the time, the market worried that a global trade war would lead to supply chain disruptions, declining corporate profits, and rising unemployment, which pushed the NASDAQ into a bear market (a drop of more than 20%) within days.
However, the NASDAQ took only about two months to rebound from its low to previous highs, much faster than the average recovery time for similar-sized corrections in history. This reflects that the current market's main strengths are abundant liquidity, strong investor confidence in AI trends, and the execution of 'buy-the-dip' strategies.
V. Strategy Recommendations
Core conclusion: A 5% yield itself does not have special market significance.Statistics since 1977 show that stock market returns during periods when yields ≥ 5% versus <5% are almost identical. Investors should not make drastic portfolio adjustments simply because yields break through 5%. The speed of yield changes is more important than their absolute level. However, after yields have consolidated in the 4.5%-5% range for several months, the market has already fully priced this in, so breaking through 5% no longer constitutes new negative news.
Trigger conditions for yield peaks and subsequent declines:
1. Fed policy pivot, typically triggered by economic slowdowns, financial crises, or easing inflation.
If the unemployment rate rises above 5% and nonfarm payrolls show consecutive negative growth, the Fed will be forced to accelerate interest rate cuts.
A further decline in core PCE to 2% requires continued cooling in energy prices and rents. The current Middle East conflict is keeping oil prices high, posing resistance to inflation easing.
Category recommendations:
The performance of technology stocks depends more on earnings growth than valuation expansion driven by interest rate levels (though it would be a bonus if present). By 2026, 'AI spending will account for 50% of GDP growth,' significantly higher than the 10% in 2019. This structural shift is reshaping the traditional relationship between interest rates and the stock market.
Medium-term investors (1-3 years): If yields break above 5.5% and continue rising, beware of the risk of valuation compression and consider moderately reducing positions to lock in profits. For tech stock holders, differentiate between interest-rate-sensitive and interest-rate-immune tech stocks — capital-intensive and highly leveraged tech stocks are more sensitive to interest rates, while software giants with strong cash flows and pricing power are relatively immune.
Income-oriented investors: Consider moderately allocating to short-duration US Treasuries (1-3 years) to lock in current yields of around 5%, while reducing exposure to interest rate risks.
Disclaimer
This report is prepared by Futu Securities International (Hong Kong) Limited ('Futu Securities'). Without prior written consent from Futu Securities, this report and the information contained herein shall not be (i) reproduced, photocopied, or stored in any form, or (ii) directly or indirectly distributed or transferred to any other person for any purpose.
The information in this report comes from sources that Futu Securities believes to be correct and reliable at the time of publication, but this report is not intended to include all the information that investors may need and may be affected by delays, blockages, or interceptions. Futu Securities does not expressly or implicitly guarantee or represent the adequacy, accuracy, completeness, reliability, or fairness of any such information or opinions. Therefore, Futu Securities and its affiliated companies (collectively referred to as the 'Futu Group') will not be liable for any type of loss (including but not limited to any direct, indirect, or consequential loss) arising from actions taken by any third party relying on the content of this report.
The views, recommendations, suggestions, and opinions expressed in this report do not necessarily reflect the position of Futu Securities or its affiliated companies and may be changed without notice. Futu Securities has no obligation to provide updates to any information or opinions.
This report is solely for the general provision of data and is intended for general review by clients of Futu Securities, without considering any specific investment objectives, financial situation, or particular needs of any specific recipient. Any information or opinions in this report do not constitute or imply an offer, recommendation, or solicitation by any member of the Futu Group to buy or sell any securities, related investments, or other financial instruments, nor should it be construed as an offer or invitation to purchase or sell securities. Any decision to purchase securities mentioned in this research report should take into account existing public information, including any prospectus related to such securities.
The products mentioned in this report may not be suitable for all investors. Individuals reading this report should fully consider relevant factors and seek professional advice before making any investment decisions. The distribution of this report to a recipient is based on the assumption that the recipient is capable of independently assessing investment risks and exercising independent judgment regarding investment decisions. In some jurisdictions or countries, the distribution, issuance, or use of this report may conflict with local laws, regulations, rules, or other registration or licensing requirements. This report is not intended for distribution or use by anyone or entity in those jurisdictions or countries. Investors in Hong Kong with questions about Futu Securities research reports are advised to contact Futu Securities directly.
The central number of the author's license issued by the Hong Kong Securities and Futures Commission has been disclosed next to the author's name on the front page of this report. The primary analyst responsible for preparing this report confirms:
1. The opinions expressed in this report accurately reflect his/her personal views on the listed corporation commented on in this research report.
2. No part of the compensation he/she has received in the past, is currently receiving, or will receive in the future, whether directly or indirectly, is related to the special recommendations or views expressed in this report.
The analyst confirms that neither the analyst nor any associated persons have traded the listed corporation and its related securities discussed in the report within 30 days prior to the issuance of the research report and within three business days after the issuance of the research report. Neither the analyst nor any associated persons hold any senior management positions in the listed corporation commented on in this research report, nor do they hold any financial interests in it.
In this report, Futu Securities holds no financial interest exceeding 1% of the market value of the listed company, and has had no investment banking relationship with the company in the past 12 months. Employees of our company are not employees of the listed company.
Risk Disclaimer: The above content only represents the author's view. It does not represent any position or investment advice of Futu. Futu makes no representation or warranty.Read more

Comment (1)
to post a comment
3
3