
2026 IPO frenzy! Over 90% of new listings rose on their debut day
Tian Tong Vision still unprofitable: L4 gross margin plunges, accounts receivable continue to rise
As smart driving transitions from concept to mass production, solution providers centered on software are becoming new targets for capital markets.
Recently, Suzhou TianTong Vision Technology Co., Ltd. (referred to as TianTong Vision) submitted an application for listing to the Hong Kong Stock Exchange, planning to issue H-shares and go public on the Hong Kong stock market, with joint sponsors being BOC International, HSBC, and Huatai International.
The prospectus shows that the company was established in 2016 and is a leading intelligent driving solutions provider in China focused on software, with business covering automation levels L2-L2+ and L4, offering global markets smart driving, parking solutions, L4-level autonomous driving kits, turnkey solutions, and other services.
According to data from CIC Consulting, by installation volume in 2024, the company is the second-largest intelligent driving solutions provider in China centered on software; by overseas shipment volume of pre-installed solutions in 2024, it is also the largest L2-L2+ level intelligent driving solutions provider in China centered on software.
However, behind the explosive growth of its L4 business, issues such as gross margin fluctuations, customer concentration risks, and ongoing losses still cast a shadow of uncertainty over this IPO.
Significant gross margin volatility, profitability path yet to be validated
Financial data shows that TianTong Vision achieved rapid revenue growth during the performance record period. In 2022, 2023, and 2024, the company's revenues were 172 million, 204 million, and 483 million respectively, with a compound annual growth rate of 67.7% from 2022 to 2024. Entering 2025, the growth momentum further accelerated, with revenue reaching 157 million in the six months ended June 30, 2025, a surge of 182.1% compared to 55.77 million in the same period of 2024.
The prospectus explains that the significant revenue growth in 2024 was mainly due to a substantial increase in L4-level revenue; while the sharp revenue rise in the first half of 2025 was primarily driven by the rapid expansion of L4-level business, especially the increased delivery volume of high unit-price integrated hardware and software solutions.
The dramatic change in revenue structure has become a key clue to understanding TianTong Vision’s financial performance. In 2022, the company's revenue mainly relied on L2-L2+ solutions, with this segment contributing 94.6 million in revenue, accounting for 55.1% of total revenue. In 2023, with the completion of several major L2-L2+ software development projects, revenue from this segment surged to 184 million, accounting for up to 90.2%.
However, in 2024, L4 solutions emerged as a standout, generating revenue of 243 million, with the share soaring from 3.6% in 2023 to 50.2%, occupying more than half of total revenue for the first time; meanwhile, although L2-L2+ revenue rose to 187 million during the same period, its share dropped sharply to 38.8%.
In the six months ended June 30, 2025, L4 solutions generated revenue of 89.96 million, accounting for 57.2%, while the share of L2-L2+ fell to 36.8%. Revenue from engineering services also grew from 4.64 million in 2022 to 52.51 million in 2024, becoming another important revenue source.
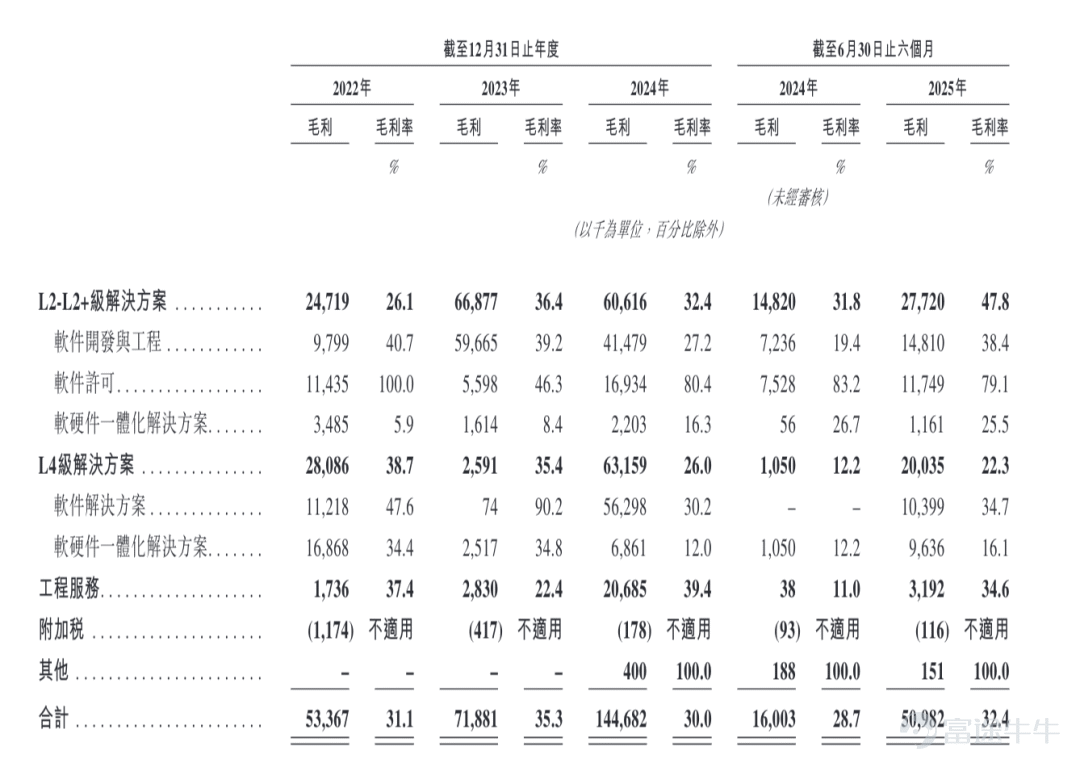
In contrast to the company's soaring revenue, its gross margin has shown significant fluctuations. For the fiscal years 2022 and 2023, as well as for the six months ended June 30, 2024, and June 30, 2025, the company’s gross margins were 31.1%, 35.3%, 30.0%, 28.7%, and 32.4%, respectively.

Looking at different business segments, the gross margin for L2-L2+ level solutions is relatively high, while the gross margin for L4 level solutions is under significant pressure.
The prospectus shows that the core reason for the low gross margin of L4-level business lies in its significantly higher technological complexity and customization compared to L2-L2+ levels, requiring higher software development costs and greater cost investment per unit of revenue.
More critically, profound changes are occurring within the internal structure of the L4 business: In 2024, pure software solutions accounted for 76.55% of this segment’s revenue, while integrated hardware-software solutions made up only 23.52%. By the first half of 2025, the proportion of integrated hardware-software solutions surged to 66.62%, with pure software dropping to 33.32%. Since integrated solutions require the procurement of external hardware components, their gross margin is much lower than that of pure software models, directly reducing the overall gross margin of L4-level operations.
Additionally, the L4 business currently focuses on B-end customers like fleet operators, using a project-based delivery model. In the early stages of commercial expansion, the company may adopt a relatively conservative pricing strategy to secure strategic clients and large-scale orders, sacrificing some profit margins in the short term. Coupled with the fact that this business is still in its initial growth phase, fixed costs are not sufficiently amortized, modular reuse is limited, and economies of scale have yet to be fully realized, all contributing to temporarily low L4-level gross margins.
The company expects that as economies of scale take effect and modular development efficiency improves, the gross margin of L4 solutions will increase. This fluctuation trajectory indicates that the company's overall profitability is highly sensitive to changes in its business mix. While L4 business supports revenue growth, it has yet to contribute an equivalent level of profit margin.

Angel investor and senior artificial intelligence expert Guo Tao stated:"L4 autonomous driving is in its early commercialization stage. Caltrop Vision's 'revenue-for-profit' strategy is viable in the short term but lacks long-term sustainability. In the industry's nascent stage, capturing market share through integrated hardware-software deliveries and accumulating scenario data is necessary. However, relying on low prices or high costs to drive revenue over the long term will continuously exacerbate cash flow pressures. Moreover, since core clients are fleet operators, whose payment capabilities are tied to their own commercial progress, demand stability is weak, further increasing long-term operational risks."
There is a natural cap on the gross margin of L4-level integrated hardware-software solutions: The proportion of externally purchased hardware such as lidar and high-performance chips is high, and there is strong demand for customized scenarios. Economies of scale develop much slower than for standardized products. Industry data shows that pure software solutions can achieve gross margins of 60%-70%, while integrated solutions range between 20%-30%. If hardware costs remain persistently high, gross margins will be difficult to significantly improve."
The loss situation reflected on the income statement also deserves close attention. For the fiscal years 2022, 2023, 2024, and the six-month periods ending June 30, 2024, and June 30, 2025, the company's annual losses and total comprehensive expenses were -325 million, -231 million, -463 million, -125 million, and -193 million, respectively.
This means that the loss in 2024 expanded by 100.3% compared to 2023, and the loss in the first half of 2025 increased by 54.5% compared to the same period in 2024.
However, the prospectus explained that the net loss during the performance record period was mainly due to non-recurring, non-cash losses from changes in the fair value of financial liabilities related to redeemable preferred shares, which are accounted for at fair value through profit or loss.
Excluding these factors, the adjusted loss and total comprehensive expenses (non-IFRS measure) have significantly narrowed, decreasing from -188 million in 2022 to -88.1 million in 2023, and further shrinking to -4.38 million in 2024; the adjusted loss in the first half of 2025 was -4.17 million, a reduction of 42.1% compared to 7.21 million in the same period of 2024, demonstrating continuous improvement in operational efficiency.
Changes on the expense side also confirm the company's transition from 'heavy R&D expansion' to 'efficiency-first.' The percentage of R&D expenses to revenue has continued to decline, dropping from 108.7% in 2022 to 51.8% in 2023, 24.3% in 2024, and further to 11.6% in the first half of 2025. In terms of absolute amounts, R&D expenses decreased from 187 million in 2022 to 106 million in 2023, slightly increased to 117 million in 2024, and were 18.31 million in the first half of 2025.
Sales and marketing expenses also maintained a contracting trend, with their share of revenue falling from 7.1% in 2022 to 1.1% in 2024, and standing at 3.0% in the first half of 2025. The proportion of administrative expenses to revenue also declined from 21.7% in 2022 to 6.1% in 2024, and was 12.0% in the first half of 2025. Additionally, other expenses of 9.015 million were incurred in the first half of 2025, primarily related to listing expenses.
Large fluctuations in customer concentration and consistently negative operating cash flow.
While rapidly expanding its business scale, the risk of customer and supplier concentration faced by TianTong Vision cannot be ignored, with relevant indicators showing significant fluctuations during the performance record period.
In terms of customer concentration, revenues from the top five customers in 2022, 2023, 2024, and the first half of 2025 (hereinafter referred to as the reporting period) were 125 million, 186 million, 215 million, and 99.9 million respectively, accounting for 73.0%, 91.4%, 44.6%, and 63.5% of total revenue for each respective period.
Among them, revenues from the largest customer were 44.25 million, 127 million, 73.5 million, and 34.81 million respectively, representing 25.8%, 62.1%, 15.2%, and 22.1% of the total. In 2023, reliance on the largest customer once surged to 62.1%, with the top five customers accounting for a high of 91.4%, indicating a strong concentration of customers.
Although in 2024, with diversified customer expansion, the share of the largest customer dropped back to 15.2% and the top five customers fell to 44.6%, in the first half of 2025, the share of the largest customer rebounded to 22.1%, and the top five customers rose again to 63.5%. This fluctuation trajectory of 'first concentration, then dispersion, and re-concentration' reflects the difficulty in fundamentally eliminating dependence on key major customers at different business stages, while the project-based delivery characteristics of L4 level business may further exacerbate this cyclical volatility.
The prospectus frankly states that if the company loses one or more major clients, or there is a significant reduction in sales related to these clients, it could have a materially adverse impact on its business, financial condition, and operating performance.
A similar pattern of volatility and concentration can be observed on the supplier side. During the reporting period, purchases from the top five suppliers amounted to 223 million, 115 million, 116 million, and 60.774 million yuan respectively, accounting for 55.0%, 72.6%, 34.9%, and 31.2% of total purchases for each respective period. Among them, purchases from the largest supplier were 78.085 million, 60.652 million, 35.558 million, and 29.916 million yuan, representing 19.3%, 38.4%, 10.7%, and 15.4% respectively.
Further analysis shows that supplier concentration peaked in 2023, with the top five suppliers accounting for 72.6% and the largest supplier making up 38.4%, directly tied to increased outsourcing needs for large-scale L2-L2+ software development projects during the year. In the first half of 2024 and 2025, as the share of L4-level business grew and internal R&D capabilities strengthened, supplier concentration decreased but remained at relatively high levels.
More notably, there is a significant overlap between customers and suppliers at TianTong Vision, which adds complexity to business relationships and raises potential conflict-of-interest risks.
During the reporting period, to the best of the directors' knowledge: ZF was one of the top five suppliers in 2022 and 2023 and also one of the top five customers in 2023. Revenue from ZF amounted to 3 million, 22.3 million, 18.9 million, and 1.4 million yuan, representing 1.7%, 10.4%, 4.0%, and 0.9% of total revenue respectively.
Supplier N (also Customer D) was among the top five customers in 2022, 2023, and the first half of 2025, and also one of the top five suppliers in the first half of 2025. Revenue from this customer during the same periods was 19.4 million, 16.1 million, 12.6 million, and 11.9 million yuan, representing 11.3%, 7.6%, 2.7%, and 7.6% respectively.
Additionally, Customer C, one of the top five customers in 2022, was also a company supplier. The company’s purchases from Customer C in 2022 and 2023 were 1.1 million and 0.063 million yuan, accounting for 0.6% and 0.0% of total purchases respectively. Customer H, one of the top five customers in 2023, was also a company supplier. Purchases from Customer H in 2023 and the first half of 2025 were 0.2281 million and 0.013 million yuan, representing 0.1% and 0.1% respectively.
Regarding capital utilization, the company's working capital requirements significantly increased alongside revenue growth. Trade and other receivables, as well as prepayments, surged from 111 million yuan at the end of 2023 to 363 million yuan at the end of 2024, further rising to 391 million yuan by the end of June 2025. This increase far outpaced revenue growth during the same period, indicating room for improvement in bargaining power within the supply chain and potentially longer collection cycles. The days sales outstanding for trade receivables were 233 days, 191 days, 166 days, and 408 days respectively.
In terms of post-period collections, as of August 31, 2025, 46.7 million yuan or 12.7% of trade receivables recorded as of June 30, 2025, had been subsequently settled.
During the same period, TianTong Vision’s inventory stood at 5.784 million, 4.218 million, 4.108 million, and 5.711 million yuan respectively. The increase in the first half of 2025 was directly linked to higher stocking levels caused by increased deliveries of L4-level integrated hardware and software solutions. Inventory turnover days were 15, 14, 5, and 8 days respectively. Contract costs rose from 12 million yuan at the end of 2024 to 22 million yuan by the end of June 2025, reflecting cash tied up in ongoing projects.
Regarding subsequent carryover, as of August 31, 2025, RMB 1.3 million (accounting for 22.80%) of the inventory recorded on the company’s books as of June 30, 2025, has been sold or used.
The performance of net cash flow from operating activities further reveals pressures at the working capital level. The net cash inflow or outflow from operating activities for 2022, 2023, 2024, and the six months ended June 30, 2024, and June 30, 2025, were -RMB 171 million, RMB 115 million, -RMB 189 million, -RMB 143 million, and -RMB 74.113 million, respectively.
Specifically, except for 2023 when an improvement in working capital changes resulted in a net inflow, all other periods showed a net cash outflow from operating activities. The continued net outflow during 2024 and the first half of 2025 was closely related to the occupation of funds by accounts receivable and inventory. Although the net outflow in the first half of 2025 narrowed compared with the same period in 2024, whether the company can achieve a positive cycle in operating cash flow while experiencing rapid revenue growth remains a key indicator for verifying the health of its business model.
Guo Tao further stated: 'Overlap between customers and suppliers (such as ZF), consistently negative operating cash flow, and a significant increase in days sales outstanding directly reflect that TianTong Vision's bargaining power within the industry chain is relatively weak. Original equipment manufacturers and Tier 1 manufacturers hold the dominant rights over scenarios and orders, and the company often needs to accept terms like extended payment periods and directed procurement of partner hardware, which subsequently leads to pressure on cash flow.'
Overlapping customers and suppliers present dual risks: at the governance level, it can easily lead to unfair related-party transactions and profit shifting, affecting corporate operational independence; at the operational level, fluctuations in partners’ businesses will simultaneously impact the company’s procurement costs and sales revenues, amplifying operational risks.'
A dramatic change in financial structure is another important observation window. The company's net asset value changed from -RMB 664 million at the end of 2022, -RMB 895 million at the end of 2023, -RMB 1.358 billion at the end of 2024, to a positive RMB 499 million as of June 30, 2025. The significant improvement in net liabilities was not entirely due to the accumulation of operating profits but rather more reliant on cash supplements from financing activities. The cash flow statement shows that the net cash inflow from financing activities in the first half of 2025 was as high as RMB 501 million, directly increasing the closing cash and cash equivalents to RMB 374 million. (Produced by Harbor Finance)
"Harbor Business Observation" Xu Huijing
Risk Disclaimer: The above content only represents the author's view. It does not represent any position or investment advice of Futu. Futu makes no representation or warranty.Read more
Comments
to post a comment