

Korean stocks rebound? Samsung may announce a 90 trillion won share buyback
Asia AI Treasure Hunt: Japanese Stocks Hit New Highs Again [Southern East Money ETF Market Brief]
(This article was initially published in the investment column of the Hong Kong Economic Times, 'ETF Spotlight')

Summary:
- Looking across Asian markets, AI and semiconductors have become the main drivers of this round of market activity. The Nikkei 225 has consecutively broken through the 62,000 and 63,000-point barriers, continuously setting new all-time highs.
- Supported by three core pillars—profitability from external demand, leadership in semiconductor equipment, and the benefits of the AI industry—Japanese stocks have steadily strengthened for three consecutive years, with further upward momentum remaining robust.
- The Nikkei 225 is heavily weighted toward AI and leading semiconductor technology companies, offering a pronounced advantage in excess returns, making it an optimal choice for investing in Japanese equities.
- Investors can leverage$CSOP Nikkei 225 Index ETF (03153.HK)$ and$CSOP Nikkei 225 Daily (2x) Leveraged Product (07262.HK)$to flexibly capture opportunities in Japan's AI-driven market movements.
Investors are turning their attention to Asia, seeking the next breakthrough point in the global stock market rally. Japan's recent historic performance has already become a focal point in the market.
On May 7, following the end of the holiday period in the Japanese market, trading resumed with a strong rebound. The Nikkei 225 index surged over 5% during the session, breaking through the 62,000-point mark for the first time, marking the official entry into a new phase of recovery for the Japanese market. Within just a few days, the momentum continued as the index broke through the 63,000-point barrier on May 13, repeatedly setting new historical highs, with market enthusiasm continuing to rise.
This wave of gains has been primarily driven by AI and semiconductor technology stocks, compounded by the positive impact of easing tensions in the Middle East, propelling the index to explosive growth.Since the beginning of this year, the Nikkei 225 Index has grown by approximately 25%, with a projected increase of about 26% for the whole year of 2025, while the full-year rise for 2024 was nearly 20%. It has achieved significant growth for three consecutive years, with a very strong trend.
Against the backdrop of the continuous realization of AI industry logic, the momentum for Japan's stock market rise is expected to continue. Investors may focus on $CSOP Nikkei 225 Index ETF (03153.HK)$ and$CSOP Nikkei 225 Daily (2x) Leveraged Product (07262.HK)$ to seize the opportunity in this market trend.
(1) Overseas demand-driven profitability forms the foundation of the index
One of the core reasons behind the rise of Japan's stock market is overseas demand-driven corporate profitability. For Japan’s top 60 companies by market capitalization, overseas revenue accounts for more than 50% generally. Overseas income determines Japanese companies' profits, rather than domestic revenue. With the current robust global economy and the continued depreciation of the yen, Japanese companies' profitability has been further enhanced, directly driving the Nikkei Index higher.
Chart 1: Overseas revenue share of Japan's top 60 companies by market cap generally exceeds 50%
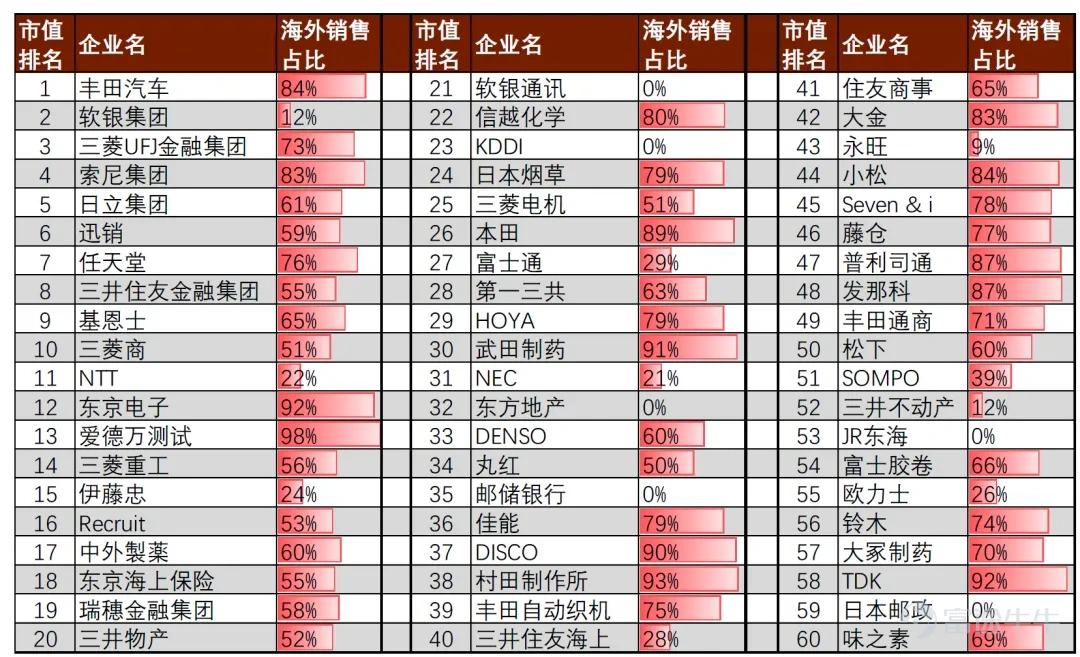
Data source: CICC Research, overseas revenue data as of fiscal year 2024
(2) Japan holds significant advantages in the semiconductor equipment industry
Japan holds irreplaceable advantages in the semiconductor equipment industry, particularly concentrated in niche markets with relatively fragmented sizes (below USD 5 billion) and high tacit knowledge barriers. Japanese companies, leveraging their IDM tradition and precision manufacturing expertise, dominate the 'chemical-based' equipment such as coating, developing, and cleaning, with a market share generally exceeding 50%.
Chart 2: Global semiconductor front-end equipment market
Japanese companies hold a market share of over 50% in the coating, developing, and cleaning fields.
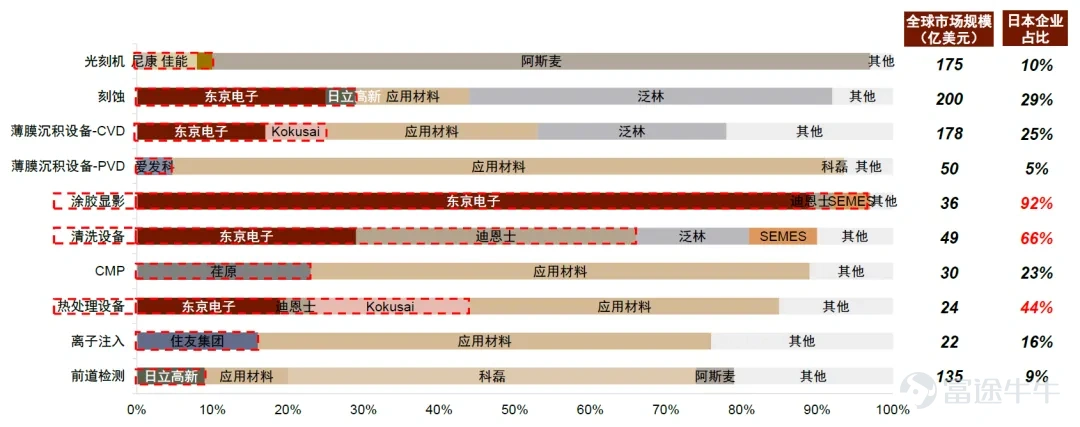
Data source: CICC Research; unless otherwise specified, all data are from 2022. Market competition patterns for thin-film deposition, heat treatment, ion implantation, and front-end inspection are based on 2020 data. The market size for heat treatment and ion implantation is estimated proportionally from 2020 to 2022. Data for cutting, thinning equipment, and testing equipment are from 2022, and the rest are from 2019.
(III) Driven by the AI wave, Japan's tech exports continue to grow rapidly.
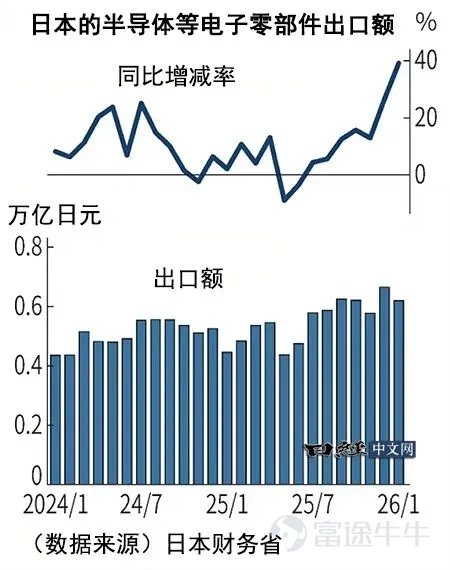
The explosive growth in global AI computing power demand has driven continuous increases in capital expenditures within the semiconductor industry. As a leader in specific segments of the semiconductor supply chain, Japan has become a direct beneficiary.
Japan’s export value of electronic components such as semiconductors has exceeded the same period last year for seven consecutive months. Since autumn 2025, it has maintained double-digit growth. In December 2025, it increased by 27% year-on-year, reaching a record high of 664.9 billion yen in a single month. In January 2026, the growth rate further expanded, with a year-on-year increase of 39%.
Exports of semiconductor manufacturing equipment also grew simultaneously, increasing by 10% year-on-year in January 2026. Exports to China and South Korea performed particularly well, driven by AI investments, cloud capital expenditures, and inference demand.
Chart 3: Japan’s electronic component exports in January, including semiconductors
Growth expanded to 39%
Leading technology weighting
Nikkei 225 Index becomes the core target of the rebound
The divergence within the Japanese stock market is evident, with the Nikkei 225 Index significantly outperforming the TOPIX Index, allowing it to benefit more fully from this round of market gains. Research from CSOP shows that in April, the Nikkei 225 Index outperformed the TOPIX Index by nearly 10%.
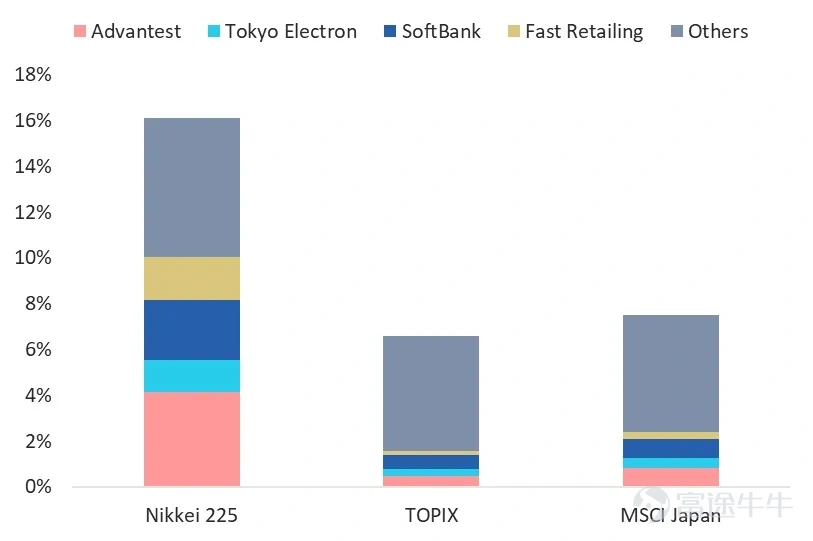
This difference stems from the distinct compilation rules of the two indices:The Nikkei 225 Index uses a price-weighted methodology, assigning higher weights to high-priced technology leaders in AI and semiconductors, which are precisely the core contributors to this market rally.On the other hand, the TOPIX Index employs a free-float market capitalization weighting method, covering a broader range of stocks, making it difficult to fully capitalize on the excess returns brought by the tech sector. Therefore, the Nikkei 225 Index has become the central target of this rebound in the Japanese stock market.
Chart 4: The increase of the Nikkei 225 Index in April
Outperformed TOPIX and MSCI Japan Index by approximately 10 percentage points
Data Source: CSOP, Blackrock iShares. Due to limited direct access to index-level data, we use the end-of-month holdings data of iShares MSCI Japan ETF (EWJ) and iShares TOPIX ETF (1475.T) as proxy indicators for estimating the sector/industry composition and return attribution of the MSCI Japan Index and TOPIX Index.
Chart 5: The Nikkei 225 Index holds a higher weighting in the semiconductor industry
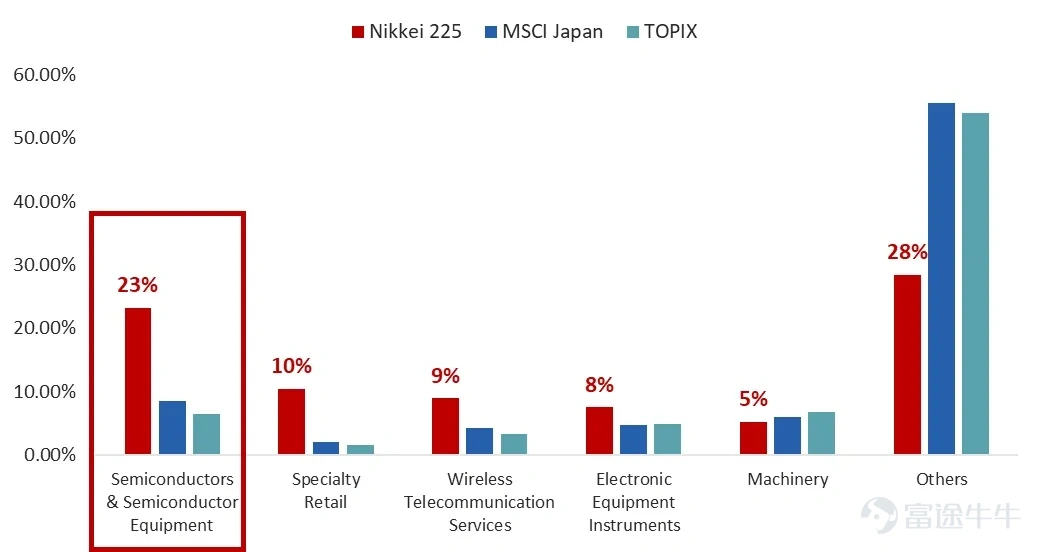
Data Source: CSOP, Blackrock iShares. Due to limited direct access to index-level data, we use the end-of-month holdings data of iShares MSCI Japan ETF (EWJ) and iShares TOPIX ETF (1475.T) as proxy indicators for estimating the sector/industry composition and return attribution of the MSCI Japan Index and TOPIX Index.
AI industrial chain continues to gain momentum
Southern East Money Nikkei 225 Index ETF Captures Gains from Market Rally
Japan's stock market boasts robust upward momentum, supported by strong external demand, a competitive edge in semiconductors, and the benefits of AI. In response to this vigorous rally, investors can deploy the following two products to flexibly align with their individual risk appetites:
1. Southern East Money Nikkei 225 Index ETF (03153):As a core product that directly tracks the Nikkei 225 Index, it captures the sustained upside benefits of this AI-driven rally.
2. Southern East Money Nikkei 225 Daily Leveraged (2x) Product (07262):By leveraging, we aim to amplify investment opportunities in the Japanese stock market.
1Investing, as of May 7, 2026
2Wind, as of May 13, 2026
3Wind, data as of May 13, 2026. For 2026, the year-to-date performance is calculated from the first trading day of the year through May 12, 2026; the full-year performance for 2025 and 2024 is based on each year's year-end closing prices.
4 CICC Research. Overseas revenue data are current as of the 2024 financial report.
CICC research. Unless otherwise specified, all data are from 2022; the competitive landscape for thin-film deposition, thermal treatment, ion implantation, and front-end inspection is based on 2020 data; the market size for thermal treatment and ion implantation is estimated proportionally from 2020 to 2022. Data for cutting, thinning, and testing equipment are from 2022; the rest are from 2019.
Japan's Ministry of Finance
Japan's Ministry of Finance
CSOP and Blackrock iShares. Data reference period: March 31, 2026, to April 30, 2026. Due to limited direct access to index-level data, we use the month-end holdings of iShares MSCI Japan ETF (EWJ) and iShares TOPIX ETF (1475.T) as proxy indicators to estimate the sector/industry composition and performance attribution of the MSCI Japan Index and TOPIX Index.
Disclaimer:
The products described in this document have been authorized by the Securities and Futures Commission (SFC). Such authorization does not imply official endorsement by the SFC.
This document is for general reference only and does not constitute investment advice or any other form of recommendation, nor should it be considered an offer or solicitation to invest in any investment product. For investment advice, please consult your professional legal, tax, and financial advisors. Investment involves risks. Past performance data is not indicative of future results. Investors should read the sales documents and product data summary of the relevant funds carefully to obtain further information, including the features of the products and all risk factors. Investors should not make investment decisions solely based on this document. This document is not applicable in jurisdictions where its distribution or transmission is prohibited. This document is not legally binding. CSOP assumes no responsibility for this document and expressly disclaims any liability for any loss arising from or in reliance on the content herein, whether in whole or in part. This document does not grant the recipient any copyright or intellectual property rights to the information contained herein (whether directly, indirectly, or implied). No part of this document may be photocopied, distributed, or reproduced without the prior written consent of CSOP.
The products described in this document may be subject to geographic, market, industry, or investment instrument concentration risks. Compared to funds with more diversified portfolios, the value of the products described in this document may fluctuate more significantly. Leveraged products are designed for short-term trading or hedging and are not suitable for long-term investments. These products are not intended to be held for more than one day, as their performance over periods longer than one day may deviate from the leveraged performance of the index during the same period and may be unrelated. Leveraged products will use leverage to achieve daily returns equivalent to twice (2x) the index return. Both gains and losses will be magnified. The products described in this document may invest in derivative instruments, and there is no guarantee that the principal will be repaid. For disclaimers by the index provider, please refer to the offering documents of the relevant fund. This document is prepared by CSOP and has not been reviewed by the Securities and Futures Commission.
Issuer: CSOP Asset Management Limited
$CSOP NVIDIA Daily (2x) Leveraged Product (07788.HK)$$CSOP NVIDIA Daily (-2x) Inverse Product (07388.HK)$ $CSOP Tesla Daily (2x) Leveraged Product (07766.HK)$$CSOP Tesla Daily (-2x) Inverse Product (07366.HK)$$CSOP Coinbase Daily (2x) Leveraged Product (07711.HK)$$CSOP Coinbase Daily (-2x) Inverse Product (07311.HK)$$CSOP MicroStrategy Daily (2x) Leveraged Product (07799.HK)$$CSOP MicroStrategy Daily (-2x) Inverse Product (07399.HK)$$CSOP Berkshire Daily (2x) Leveraged Product (07777.HK)$$Nasdaq (NDAQ.US)$$CSOP NASDAQ 100 ETF (03034.HK)$$CSOP NASDAQ-100 Index Daily (-2x) Inverse Product (07568.HK)$$CSOP NASDAQ-100 Index Daily (2x) Leveraged Product (07266.HK)$$S&P 500 Index (.SPX.US)$$CSOP FTSE China A50 ETF (02822.HK)$$CSOP Hang Seng TECH Index ETF (03033.HK)$$CSOP Hang Seng China Enterprises Index Daily (-2x) Inverse Product (07588.HK)$$CSOP Hang Seng China Enterprises Index Daily (2x) Leveraged Product (07288.HK)$$CSOP Hang Seng Index Daily (-1x) Inverse Product (07300.HK)$$CSOP HANG SENG INDEX DAILY (2X)LEVERAGED PRODUCT (07200.HK)$$CSOP HANG SENG INDEX DAILY (-2X) INVERSE PRODUCT (07500.HK)$$CSOP NASDAQ-100 Index Daily (-2x) Inverse Product (07568.HK)$$CSOP NASDAQ-100 Index Daily (2x) Leveraged Product (07266.HK)$$CSOP Gold Futures Daily (2x) Leveraged Product (07299.HK)$$CSOP CSI 300 Index Daily (2x) Leveraged Product (07233.HK)$$CSOP Hang Seng TECH Index Daily (-2x) Inverse Product (07552.HK)$$CSOP Hang Seng TECH Index Daily (2x) Leveraged Product (07226.HK)$$CSOP Nikkei 225 Daily (-2x) Inverse Product (07515.HK)$$CSOP Nikkei 225 Daily (2x) Leveraged Product (07262.HK)$$CSOP Bitcoin Futures Daily (-1x) Inverse Product (07376.HK)$$USD (USDindex.FX)$$OSE Nikkei 225 Futures (SEP6) (NK225main.JP)$$Nikkei 300 (.N300.JP)$$ICBCCS Daiwa N225 ETF(QDII) (159866.SZ)$$Huaan MUFG N225 ETF(QDII) (513880.SH)$$WisdomTree Japan Hedged Equity ETF (DXJ.US)$$iShares MSCI Japan ETF (EWJ.US)$$Japanese Yen Trust (FXY.US)$$Fast Retailing (9983.JP)$$Tokyo Electron (8035.JP)$$Advantest (6857.JP)$$SoftBank Group (9984.JP)$$Toyota Motor (7203.JP)$$Nikkei225 Bear -2x ETF (1360.JP)$$OSE Nikkei 225 Futures (SEP6) (NK225main.JP)$$Nikkei/USD Futures (SEP6) (NKDmain.US)$$Nikkei/USD Futures Current Contract (SEP6) (NKDcurrent.US)$
Risk Disclaimer: The above content only represents the author's view. It does not represent any position or investment advice of Futu. Futu makes no representation or warranty.Read more
Comments
to post a comment
5