The short-term key for Li Auto: Hold above 72.1 yuan to challenge the resistance at 80.7 yuan
As of May 14, 2026, Li Auto (02015.HK) was trading at 77.3 yuan, with a gain of 54.96%. The 5-day volatility reached 13.4%, indicating significant short-term fluctuations. Regarding technical indicators, MA10, MA30, and MA60 are at 71.23 yuan, 71.36 yuan, and 70.33 yuan respectively. The current stock price is significantly higher than the main moving averages, and the short-term and long-term moving averages show a bullish alignment, reflecting strong short- to medium-term structure. The Relative Strength Index (RSI) is at 66, in a moderately strong region, yet to reach the overbought warning line of 70.
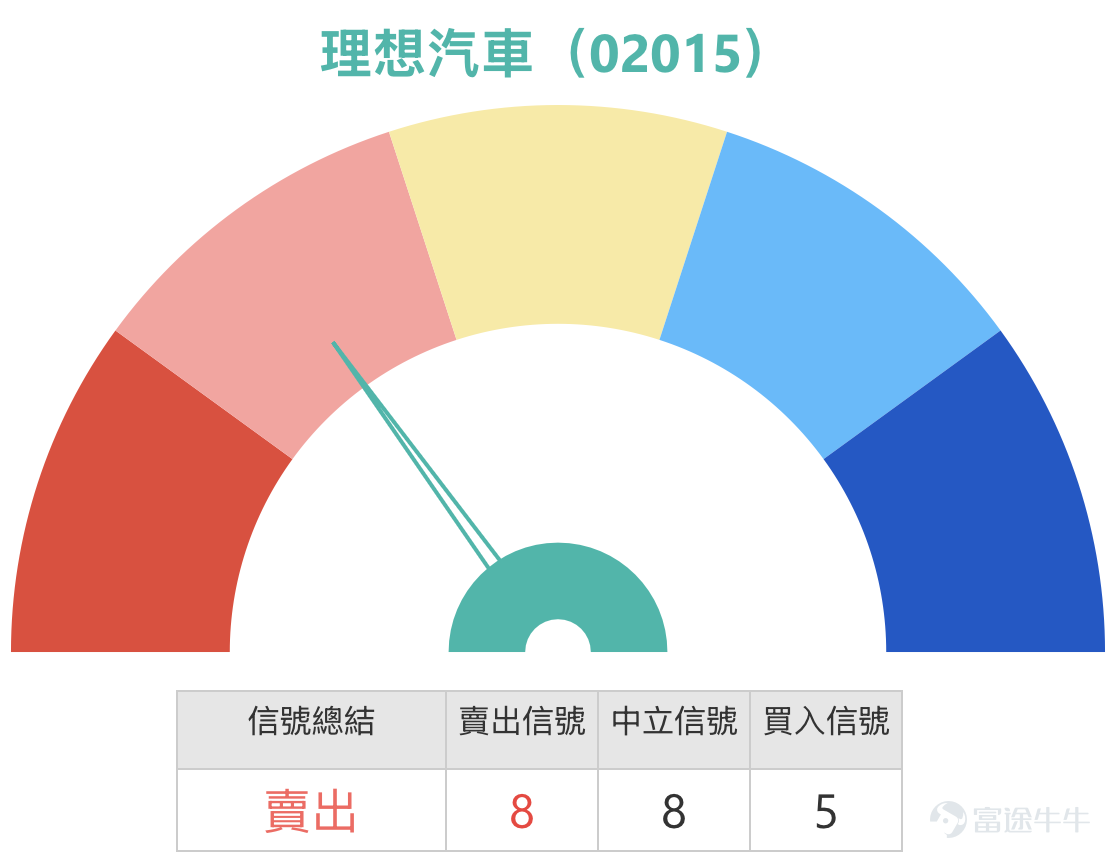
However, the consolidated technical indicator signal is 'Sell', with an intensity rating of 8, mainly due to divergence among multiple indicators — the Rate of Change (ROC) indicator shows a buy signal, the Bull-Bear Power indicator and Ichimoku Cloud both indicate buy, MACD signals and Bollinger Bands also suggest buy, but the Momentum Oscillator shows a 'top divergence' and issues a sell signal. Top divergence refers to the stock price hitting new highs while technical indicators fail to make new highs, often signaling that upward momentum may weaken. This divergence in technical signals is common after a sharp rise in stock prices enters a key resistance zone, where short-term upward momentum exists, but potential pullback pressures are accumulating.
In terms of support and resistance structures, the short-term support levels for Li Auto are set at 72.1 yuan and 68.8 yuan; resistance levels are at 80.7 yuan and 83.5 yuan. The probability of an upward move estimated by technical conditions is 51%, showing nearly balanced forces between bulls and bears. The current price is 77.35 yuan, above the first support level of 72.1 yuan and below the first resistance level of 80.7 yuan, leaving about 4.55 yuan space to the upper resistance zone, while the first support level provides a buffer of approximately 4.05 yuan. The key to the short-term trend lies in whether the stock price can hold above 72.1 yuan and further test 80.7 yuan or experience a pullback when nearing the resistance zone.

Reviewing the performance of four Li Auto warrant products mentioned on May 12 over the next two trading days. HSBC Bull Certificate (59579) recorded a 10% increase, UBS Group Bull Certificate (54694) recorded a 16% increase, UBS Group Call Warrant (24865) recorded a 12% increase, and Bank of China Call Warrant (24077) recorded a 13% increase, while the underlying stock gained 3.75% during the same period. The increases in these products were notably higher than those of the underlying stock, reflecting the leverage amplification effect of bull certificates and call warrants during the rebound of the underlying stock. $UB#LIAUTRC2608E.C (54694.HK)$$UBLIAUT@EC2609A.C (24865.HK)$$HS#LIAUTRC2612B.C (59579.HK)$

Based on current technical conditions, the following detailed term analysis of five warrant and bull/bear certificate products is provided to investors, each linked to Li Auto's support and resistance levels:
Based on technical conditions, here is a brief analysis of five products, all terms related to support and resistance levels. For call warrants, UBS Group call warrant (24865) has an exercise price of 75.93 yuan (close to the current price), leverage of 4.2 times, and an ideal implied volatility; Bank of China call warrant (24077) has the same exercise price, leverage of 4.1 times, and lower implied volatility. Both are suitable for investors optimistic about breaking through the 80.7 yuan resistance.
For bull contracts, HSBC bull contract (59579) has a recovery price of 62 yuan (well below support level 2), leverage of 4.1 times, with the highest effective leverage; UBS Group bull contract (54694) has a recovery price of 63 yuan, leverage of 4.3 times, and the lowest premium. Both provide sufficient buffer and are suitable for those expecting a rebound after holding steady above 72.1 yuan. For bear contracts, HSBC bear contract (54453) has a recovery price of 85 yuan (above resistance level 2), leverage of 6.1 times, and the lowest premium, making it suitable for short-term trading when the stock price is pressured at 80.7 yuan and falls back.

Overall, Li Auto is at a key juncture following a short-term rebound. Technical indicators show a top divergence sell signal, but multiple trend indicators still suggest buying. Investors can choose corresponding call warrants, bull contracts, or bear contracts based on their judgment of whether the stock price will break through the 80.7 yuan resistance or fall below the 72.1 yuan support. The terms of each product are closely linked to support and resistance levels, and investors should make selections based on their risk tolerance.
Warm Reminder: This article does not constitute any investment advice. It is for reference only and does not constitute any investment advice. The market data, opinions, and analysis contained herein may change at any time without prior notice. We are not responsible for any loss or damage caused by reliance on the information in this article. Technical analysis only shows whether certain technical conditions are met; a comprehensive evaluation of asset performance should be made using other data, and trading decisions should not be based solely on this article. Please note that past performance is not indicative of future results. Follow HK Stocks Warrants Jenny for more professional insights.
Risk Disclaimer: The above content only represents the author's view. It does not represent any position or investment advice of Futu. Futu makes no representation or warranty.Read more
Comment (1)
to post a comment