
PDD Holdings reported Q1 revenue of RMB 106.2 billion—has its share price already hit bottom?
Before Alibaba breaks through 140, it remains in a range-bound pattern.
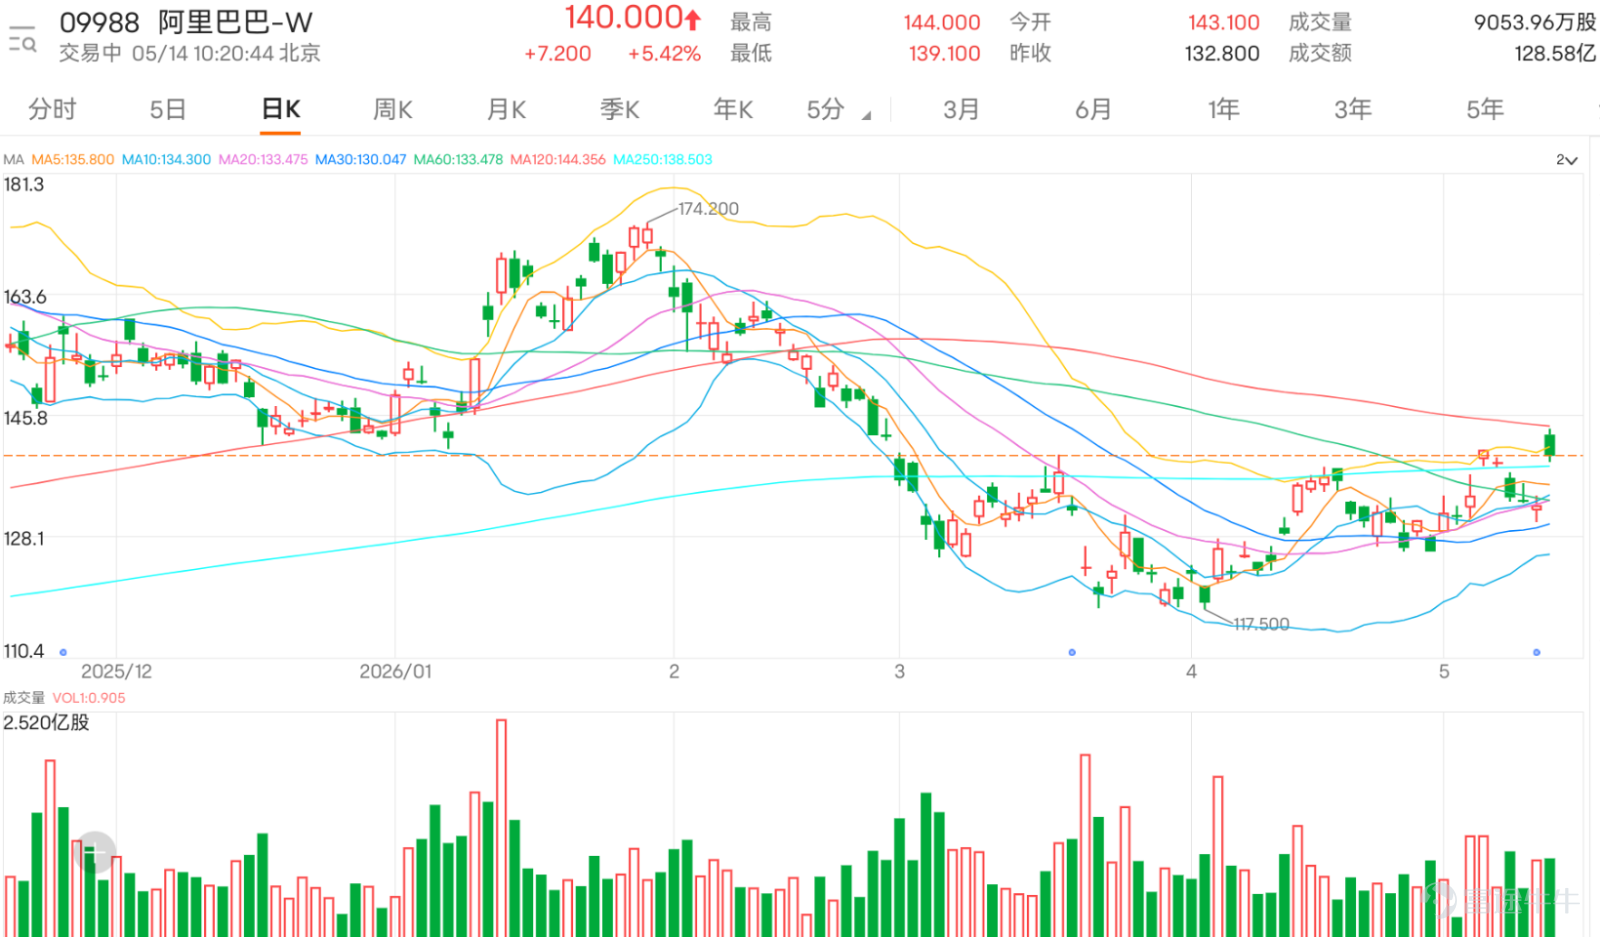
$BABA-W (09988.HK)$ At the current price of 140, the short-term trend is still in the consolidation phase following a rebound. After bouncing from the earlier low of 117.500, the stock price once approached near 140 but failed to sustain the breakout, subsequently retreating to hover around 132. From a daily chart perspective, Alibaba has temporarily moved away from its weakest position at the bottom, but an uptrend reversal has yet to be confirmed. Currently, it is closer to fluctuating within the 125 to 140 range.
Technically, the current price is slightly below the 10-day moving average of 133.360 but remains close to the 20-day moving average and the Bollinger Band middle line at 132.905, while also being above the 30-day moving average at 129.467. This structure indicates that the stock price hasn't weakened significantly, but short-term momentum is also not strong. If the price can stabilize above 133.360 again, short-term sentiment will improve slightly; if it fails to hold above 132.905, it may retest 129.467 or even 125.335.
In terms of the Bollinger Bands, the upper band is at 140.475, the middle line at 132.905, and the lower band at 125.335. The current price is near the middle line, reflecting a market in a position of directional choice. If Alibaba can break through 140.475 and stabilize, a short-term breakout would be confirmed, creating conditions to challenge higher levels. Conversely, if the price remains pressured near 140, it will continue to move within a range, making it difficult to form a clear upward trend.
The Relative Strength Index (RSI) is approximately 47.638, reflecting a neutral-to-weak level, indicating that market momentum has not strengthened significantly. This also explains why Alibaba has repeatedly attempted to rebound recently but has failed to form a smooth upward trend. For short-term investors, the most important thing at this juncture is not to hastily predict upward or downward movements but to wait for confirmation of direction.
Regarding investor sentiment, bullish comments mainly focus on earnings expectations, high opening forecasts, potential breakout points, and holding positions. This reflects that part of the market is still betting on a post-earnings rebound, especially when the stock price hasn't hit new lows. Bullish investors hope Alibaba can break through 140 yuan on positive news. However, whether this view holds ultimately depends on whether the stock price surpasses 140.475 to confirm.
Bearish comments, on the other hand, center on average performance, poor financial results, lack of new growth narratives, and Alibaba's inability to reverse its downtrend potentially dragging down the Hang Seng Index. These viewpoints indicate lingering doubts about Alibaba’s fundamentals. Although Alibaba’s valuation has retreated from previous highs, without visible new growth drivers, any price rebound could face pressure near resistance levels.
The most观望留言 (observation-focused comments) accurately reflect the current state. Some investors note that Alibaba keeps testing but lacks clear direction, consistent with technical trends. The stock price is hugging the middle axis of the Bollinger Bands and several moving averages, unable to break above 140 yuan or fall below 125 yuan, leaving the market uncertain about direction.
In terms of short-term value betting rates, Alibaba's current price is neutral. Buying near 132 yuan faces immediate resistance at 140.475, while downside defense lies at 129.467 and 125.335. Risk-reward isn’t particularly compelling here. A clearer strategy would be waiting for a confirmed breakout above 140.475 before chasing momentum or considering buying dips if the price stabilizes near 125.335. Currently in a middle position, Alibaba remains vulnerable to fluctuations driven by earnings and short-term sentiment.
Overall, Alibaba is neither a strong breakout stock nor an obviously weak one, but rather in a range-bound waiting pattern ahead of earnings. 132.905 serves as the short-term inflection point, 140.475 as the breakout confirmation level, and 125.335 as crucial support. If it can stabilize above 133 yuan and break through 140 yuan, market sentiment will significantly improve; however, a drop below 129.467 or even 125.335 would signal caution against a failed rebound.

For call warrants, consider paying attention to $BIALIBA@EC2608E.C (26562.HK)$ with a strike price of 150.09 yuan, leverage of about 7.2 times, and both its premium and implied volatility are the lowest among similar products, offering a relatively stable structure with lower costs. $HSALIBA@EC2608F.C (26604.HK)$ with a strike price also at 150.09 yuan, leverage of about 6.9 times, and its implied volatility remains at a relatively low level, suitable for investors who are bullish on the market outlook and wish to manage implied volatility risks.
For put warrants, $UBALIBA@EP2609C.P (27125.HK)$ with a strike price of 109.9 yuan, leverage of about 5.9 times, and both its premium and implied volatility are the lowest, providing a more stable bearish deployment option. $MSALIBA@EP2609B.P (27282.HK)$ with a strike price also at 109.9 yuan, leverage of 5.9 times, and its implied volatility being the lowest with relatively higher leverage, suitable for investors who are bearish on the market outlook and want to hedge risks more efficiently.
Among the bull certificate options, $UB#ALIBARC2610K.C (53984.HK)$ with a call price of 126 yuan, leverage of about 13.4 times, high actual leverage, and low premium, effectively amplifying returns for bullish positions. Another one $UB#ALIBARC2610I.C (67474.HK)$ The recovery price is 128 yuan, with leverage of approximately 16.8 times. Its premium is the lowest in its category, while actual leverage is relatively high. It suits investors who are optimistic about the short-term trend and can bear the risk of recovery.
As for bear certificates, $JP#ALIBARP2809J.P (57970.HK)$ The recovery price is 149 yuan, with leverage of about 8.9 times. Its actual leverage is the highest in its category, and the premium is lower, effectively capturing potential downside movements. $UB#ALIBARP2810G.P (69096.HK)$ The recovery price is 145 yuan, with leverage of around 12.2 times. Its premium is the lowest, while actual leverage is relatively high. It suits investors who are bearish on the market outlook and want to hedge at a lower cost.

Reply to comment
@像中槍一樣: It depends on whether it can stabilize above 140 yuan. If it opens higher but then retreats, beware of profit-taking after the news materializes.
@Fu Leung: Strong holders with low holding costs can observe support levels at 132.905 and 129.467. As long as it doesn't fall below 125.335, the rebound structure within the range remains intact.
@英俊的亨利: The earnings estimate is very mediocre; there's no story to tell. The market indeed needs a new story to support valuation recovery. If there's still no clear catalyst post-earnings, even if the stock rebounds, it may face pressure near 140.475.
@美其一生: Has someone already known about the earnings report? The market often makes early moves before earnings, but it's unreliable to judge based solely on stock price fluctuations. A more practical approach is to see if the stock can break through 140.475 post-earnings.
@520niu: For a reversal, price confirmation is needed. First, it must re-stabilize above 133.360, then break through 140.475 for a clearer bullish signal.
Feel free to share your insights in the comment section. For more market analysis, please continue following ‘Hong Kong Stock Warrants Jenny’ for daily updates!
Reminder: This article does not constitute any investment advice.
This article is for reference only and does not constitute any investment advice. Market data, opinions, and analysis contained herein may change at any time without prior notice. We are not responsible for any loss or damage caused by reliance on the information in this article. Technical analysis only shows whether certain technical conditions are met; asset performance should be comprehensively evaluated using other sources of information, and trading decisions should not be made solely based on this article. Please note that past performance is not indicative of future results.
#HKStocks #Real-TimeAnalysis #WarrantPick #WarrantGuide #DerivativesHedging #HKWarrantsJenny #Alibaba #09988 #Blue-ChipStocks #TechnicalAnalysis$Hang Seng Index (800000.HK)$$Hang Seng TECH Index (800700.HK)$
Risk Disclaimer: The above content only represents the author's view. It does not represent any position or investment advice of Futu. Futu makes no representation or warranty.Read more

Comment (1)
to post a comment
3