
The short-term rebound of the Hang Seng Index continues, but the upper resistance remains unbroken, and the risk-reward ratio still reflects range trading.
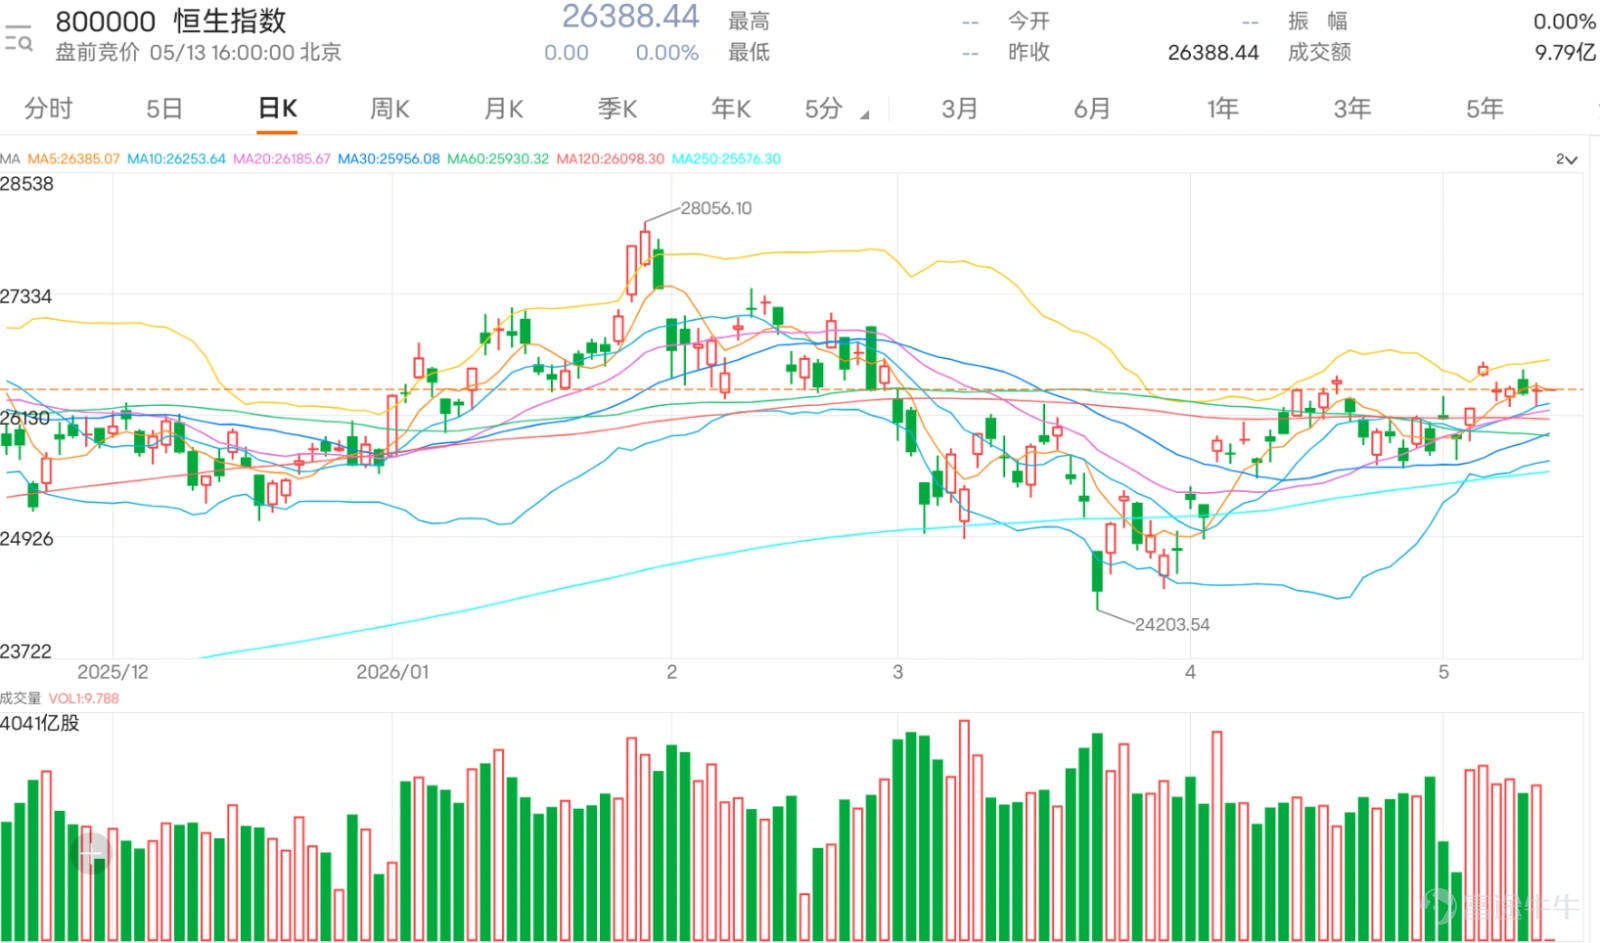
$Hang Seng Index (800000.HK)$The previous day's closing was at 26,388.44, with the short-term trend in a phase of consolidation at high levels after a rebound. Structurally, the index has seen a significant rebound from its earlier low of 24,203.54 and is gradually moving back above multiple moving averages. It is currently trading near the 10-day, 20-day, and 30-day lines, reflecting that the short-term trend has shifted from weak to stable, but has not yet entered a clear upward trend.
Regarding the Bollinger Bands, the middle band is around 26,163, the upper band is near 26,667, and the lower band is approximately 25,569. The current price is running slightly above the middle band and gradually approaching the upper band, indicating that market momentum is improving, but a breakout pattern has yet to form. As long as the price fails to effectively break through and stabilize above 26,667, the upper area will remain a resistance zone, and the overall movement will stay within a range rather than transitioning into a one-sided upward trend.
Observing the moving average structure, the short-term moving averages are beginning to converge and slightly rise, reflecting some signs of short-term capital flowing back. However, the medium- and long-term moving averages have not yet fully strengthened, suggesting that this rebound is more of a corrective bounce rather than a trend-driven rally. In other words, the market is still digesting the previous decline and has not yet confirmed a new upward trend.
The Relative Strength Index (RSI) is between 57 and 58, positioned in a moderately strong region. At this level, momentum has improved but is not overheated, nor has it formed a strong upward push. This type of structure often implies there is room for upside potential, but fluctuations or false breakouts are also likely to occur near resistance levels.
In terms of trading volume, there was an increase during the rebound process, but recent trading has not expanded further, indicating that capital inflow intentions have not continued to strengthen. If the subsequent move is to break through 26667, it must be accompanied by a significant increase in trading volume; otherwise, the upward trend is likely to be blocked, leading to range-bound fluctuations.
Based on the overall technical structure, the most critical watershed is now at 26667. If it can break through and stabilize above this level, the short-term structure could upgrade from a rebound to a breakout, opening up more upside potential. Conversely, if it remains pressured below 26667, it will still be within the range-bound consolidation between 26163 and 26667. Once 26163 is breached downwards, the mid-axis is lost, potentially triggering a retest of 25569 or even lower levels.
From a risk-reward ratio perspective, the current position does not offer an extremely high reward-to-risk ratio. The reason is that the current price is already close to the support level and also near the middle of the resistance zone, meaning the upside and downside potentials are relatively balanced. For short-term deployment, it would be better to wait for two scenarios: one, a pullback to 26163 or even lower levels to confirm support before rebounding; or two, breaking through 26667 and stabilizing before following the trend. At this stage, entering at the midpoint offers an unfavorable risk-reward ratio.
Regarding investor sentiment, we can see a clear divergence in the market. Some funds have started turning bullish, believing the rebound will continue or even lead to a surge; others think the upward momentum is weak and the market will gradually decline. This divergence itself is a typical feature of a range-bound market, indicating that the market has not formed a unified direction.
Among bullish comments, there are mentions of fund inflows into bull contracts, reflecting that some capital is indeed betting on an upward move, along with more aggressive views like 'the surge has just begun.' Such sentiments typically emerge in the middle to later stages of a rebound rather than at the start. When the market begins showing more consistent optimism, it’s important to watch out for risks associated with chasing highs in the short term.
Bearish comments tend to question the strength of the rally, for example, suggesting that the market lacks power after three o'clock or predicting a slow downward grind. This reflects that some investors haven’t fully accepted that a rebound has taken hold and remain skeptical about upward moves. Unless this divergence is broken, the market is likely to remain volatile rather than forming a one-sided trend.
Observational and sentiment-driven comments are more representative, such as questions about whether the trend will be smooth, whether positions should be held overnight, or whether large players might suppress prices. These comments reflect insufficient market confidence, with participants still favoring short-term thinking and not yet developing a willingness to hold trend-following positions.
Overall, the Hang Seng Index is currently in a consolidation range following the rebound. Technically, it appears stable but hasn’t broken out yet. Sentiment-wise, there’s noticeable divergence, and capital flows have not formed a unified direction. In the short term, the key focus remains whether 26667 can be broken through and whether 26163 can hold firm. Before any directional confirmation, the strategy should primarily involve range trading rather than one-sided bets.
Investor Comment Replies
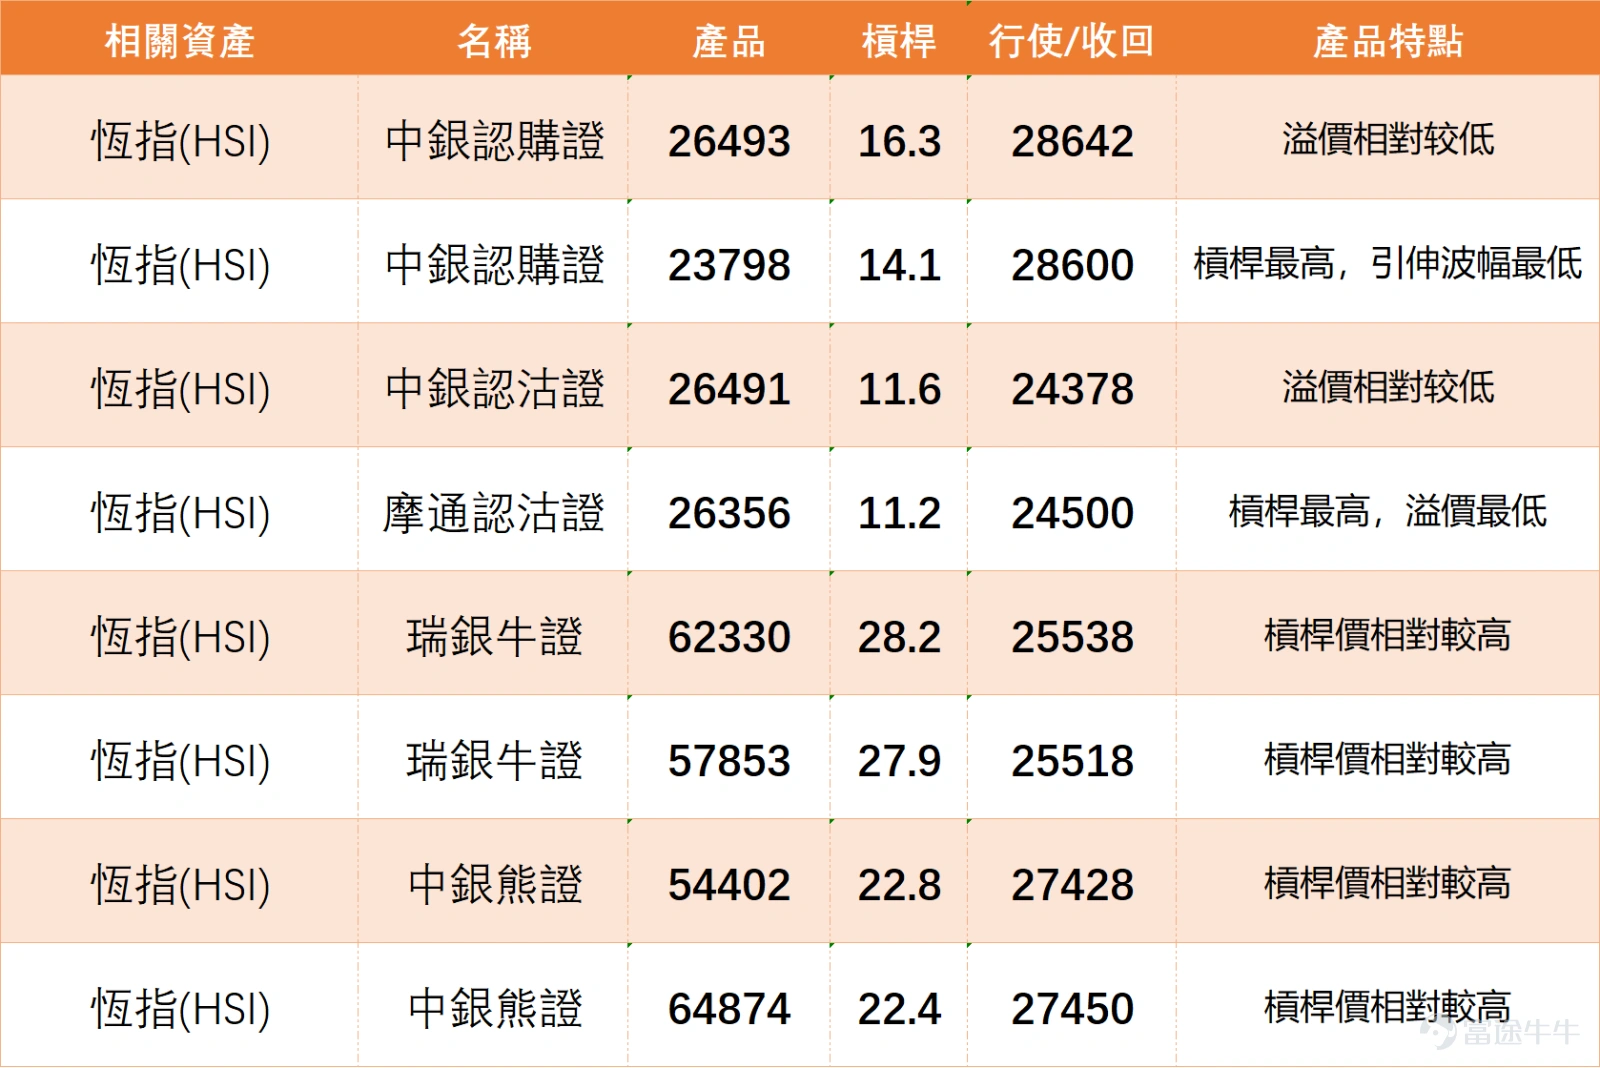
@責任感強的保羅: The bulls have accumulated another 300 million in bullish warrants in the short term, but it should be noted that if the index fails to break through 26,667 and stabilize, this type of capital inflow could easily become a buying opportunity at highs, increasing the risk of profit-taking.
@00後韭菜: Will it slowly grind down? If it remains under pressure below 26,667, there is indeed a chance of entering a weaker sideways structure, but first, we need to observe whether 26,163 holds.
@TY yu: Big player John is keeping the price suppressed. The current price is close to the resistance zone, and the appearance of selling pressure is a normal technical phenomenon; it is not necessarily intentional suppression, but it does reflect selling pressure above.
@small tiger: The area around 26,600 is a key resistance level. Breaking through and stabilizing above it would open up upside potential, otherwise, a pullback is likely.
Feel free to share your insights in the comment section. For more market analysis, please continue following ‘Hong Kong Stock Warrants Jenny’ for daily updates!
Disclaimer: This article does not constitute any investment advice.$Hang Seng TECH Index (800700.HK)$$Hang Seng China Enterprises Index (800100.HK)$
This article is for reference only and does not constitute any investment advice. Market data, opinions, and analysis contained herein may change at any time without prior notice. We are not responsible for any loss or damage caused by reliance on the information in this article. Technical analysis only shows whether certain technical conditions are met; asset performance should be comprehensively evaluated using other sources of information, and trading decisions should not be made solely based on this article. Please note that past performance is not indicative of future results.
#HongKongStocks #RealTimeAnalysis #WarrantSelection #WarrantGuide #DerivativesHedging #HongKongWarrantsJenny #HangSengIndex #HangSengTechIndex #BlueChipStocks #TechnicalAnalysis
Risk Disclaimer: The above content only represents the author's view. It does not represent any position or investment advice of Futu. Futu makes no representation or warranty.Read more

Comments
to post a comment
2