JD.com holds steady above the support level of 116.3 yuan, with potential to challenge the dense resistance zone at 134.9 yuan
As of May 13, 2026, JD.com Group (09618.HK) is quoted at 126.5 yuan, with a gain of 6.84%, indicating increased short-term volatility. In terms of technical indicators, MA10, MA30, and MA60 are located at 118.43 yuan, 117.13 yuan, and 112.10 yuan respectively. The current share price is significantly higher than all major moving averages, with short-term averages showing upward divergence, reflecting a strong short-to-medium term structure. The Relative Strength Index (RSI) is at 65, within a moderately strong range, not yet reaching the typical overbought level of 70.
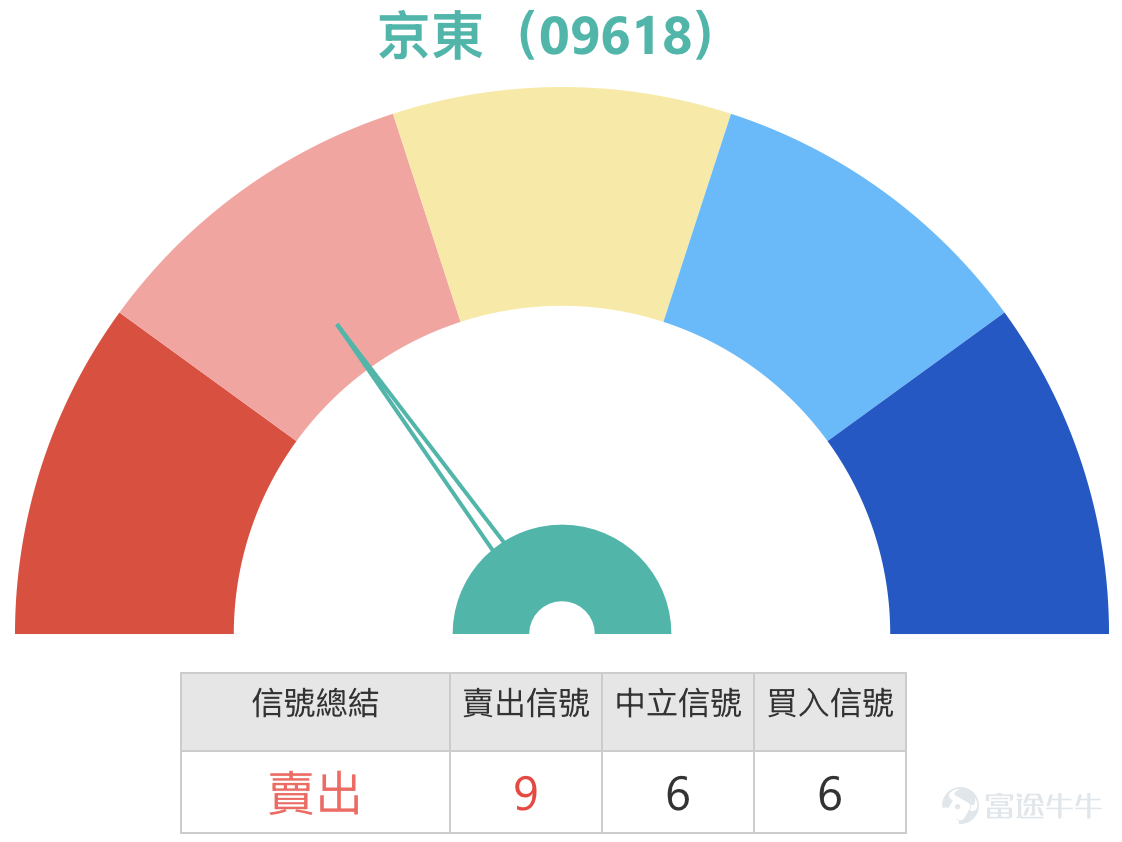
However, the overall technical indicator signal is 'sell', with a strength rating of 9, primarily due to significant divergence among various oscillation indicators—Stochastic Oscillator signals buy, ADX also indicates buy, Rate of Change similarly suggests buy, Ichimoku and MACD both show buy, but Williams %R is in overbought territory issuing a neutral signal, Momentum Oscillator shows 'top divergence' signaling sell, and Bollinger Bands also indicate sell. This clear divergence of technical signals is common when stock prices surge into resistance zones; although short-term upward momentum remains, downward pressure is accumulating.
In terms of support and resistance levels, JD.com’s short-term supports are sequentially set at 119.8 yuan and 116.3 yuan; resistances are at 134.6 yuan and 134.9 yuan, forming a dense resistance zone as the two levels are very close. Technical conditions estimate an ascending probability of 51%, showing nearly equal balance between bullish and bearish forces, requiring more catalysts for confirmation of short-term breakout direction. The closing price on May 13 was 126.7 yuan, above Support 1 and below Resistance 1, with about 7.9 yuan of room to the upper resistance zone. Bollinger Bands indicate a sell signal, suggesting the stock price may be near the upper rail of the channel, with potential short-term pullback demand.

Based on JD.com’s short-term trend analysis—the short-term and daily structures are relatively strong, but Bollinger Bands have signaled sell, and the resistance zone is close. Strategically, consider simultaneous short-term deployment of call warrants and put warrants, while bull/bear contracts should pay attention to the distance between stop-loss levels and key supports/resistances. Below is a detailed clause analysis of six products, each related to JD.com’s support and resistance levels:
Bank of China Call Warrant (26487), exercise price at 139.71 yuan, leverage approximately 4.4 times. The advantage of this product lies in its relatively low implied volatility, meaning time decay is slower, making it suitable for rebound plays when the stock price pulls back to the first support level near 119.8 yuan. The exercise price of 139.71 yuan is above the second resistance level of 134.9 yuan, qualifying it as an out-of-the-money product. If JD.com can break through the dense resistance zone between 134.6 yuan and 134.9 yuan, the potential elasticity of this warrant will increase.
The UBS Group call warrant (26873) has an exercise price of HK$139.718 and a leverage of approximately 4.6 times. Compared with similar terms offered by Bank of China, its leverage is slightly higher while implied volatility is relatively lower. This product is also suitable for investors optimistic that JD.com can break through the resistance zone and challenge higher levels. When the share price holds firmly above HK$119.8 and gradually moves upward, the sensitivity of this warrant is relatively ideal.
CMB call warrant (20436) $CIJDCOM@EP2607A.P (20436.HK)$ with an exercise price of HK$128.88 and leverage of about 5.7 times. This product offers the highest leverage among similar put warrants, while its premium and implied volatility are the lowest. The exercise price of HK$128.88 is higher than the current price of HK$126.7 but lower than the first resistance level at HK$134.6, making it a slightly in-the-money or near-at-the-money put warrant. If JD.com experiences a technical pullback after hitting the resistance zone and retreats to the support levels at HK$119.8 or HK$116.3, this warrant exhibits high time efficiency and cost advantages. Its lower implied volatility means less option premium paid when buying, making it suitable for investors expecting a pullback.
UBS Group bull contract (68762) $UB#JDCOMRC2705A.C (68762.HK)$ with a stop-loss level at HK$106 and leverage of approximately 5.3 times. The advantage of this product lies in having the lowest premium and relatively high actual leverage. The stop-loss level at HK$106 is significantly below the second support level at HK$116.3, providing ample buffer space. Even if the share price falls briefly to the support area, it is unlikely to be forcibly recalled. With the current probability of an uptrend being 51% and no clear one-sided trend, this bull contract is suitable for investors who believe JD.com will hold steady at HK$116.3 and retest the resistance level at HK$134.6.
JPMorgan bull contract (67460) $JP#JDCOMRC2810A.C (67460.HK)$ with a stop-loss level also at HK$106 and leverage of approximately 5.3 times. Its advantages include high actual leverage and low premium, with terms similar to the UBS Group bull contract. Both can serve as tools for those optimistic about a short-term rebound, but note that the Bollinger Bands signal suggests selling. The stock price may consolidate before moving up again, requiring patience for holding positions.
UBS Group bear contract (56694) $UB#JDCOMRP2808A.P (56694.HK)$ with a stop-loss level at HK$136 and leverage of approximately 11.6 times. This product’s advantage lies in having the lowest premium. The stop-loss level at HK$136 is just above Resistance Level 1 (HK$134.6) and Resistance Level 2 (HK$134.9), making it a bear contract close to the resistance zone. As the current price of HK$126.7 is HK$9.3 away from the stop-loss level, the risk is manageable, but the high leverage makes it suitable for short-term investors who believe JD.com will struggle to break through the HK$134.6–HK$134.9 range and may see a pullback. If the stock price confirms pressure at the resistance level, this bear contract can serve as a quick hedging tool.

In summary, although JD.com appears strong in the short term, technical indicators are diverging and resistance zones are dense. Investors should control their positions when deploying call warrants or bull contracts, while put warrants and bear contracts should be cautiously used after the share price hits the resistance zone.
#JD.com #09618 #Earnings #TechnicalAnalysis #CallWarrants #PutWarrants #BullBearContracts #SupportResistanceLevels #ShortTermHKStocks #WarrantStrategies
Friendly reminder: This article does not constitute any investment advice. It is for reference only and does not constitute any form of investment recommendation. Market data, opinions, and analyses presented in this article may change at any time without prior notice. We are not responsible for any loss or damage caused by reliance on the information provided herein. Technical analysis shows only whether certain technical conditions are met; asset performance should be comprehensively evaluated using additional sources of information. Decisions to trade should not be made solely based on this article. Please note that past performance is not indicative of future results. Follow HK Stocks Warrants Jenny for more professional insights.
Risk Disclaimer: The above content only represents the author's view. It does not represent any position or investment advice of Futu. Futu makes no representation or warranty.Read more

Comment (1)
to post a comment
2