English
Back
Open Account
港股窩輪Jenny
wrote a post · May 13 11:26

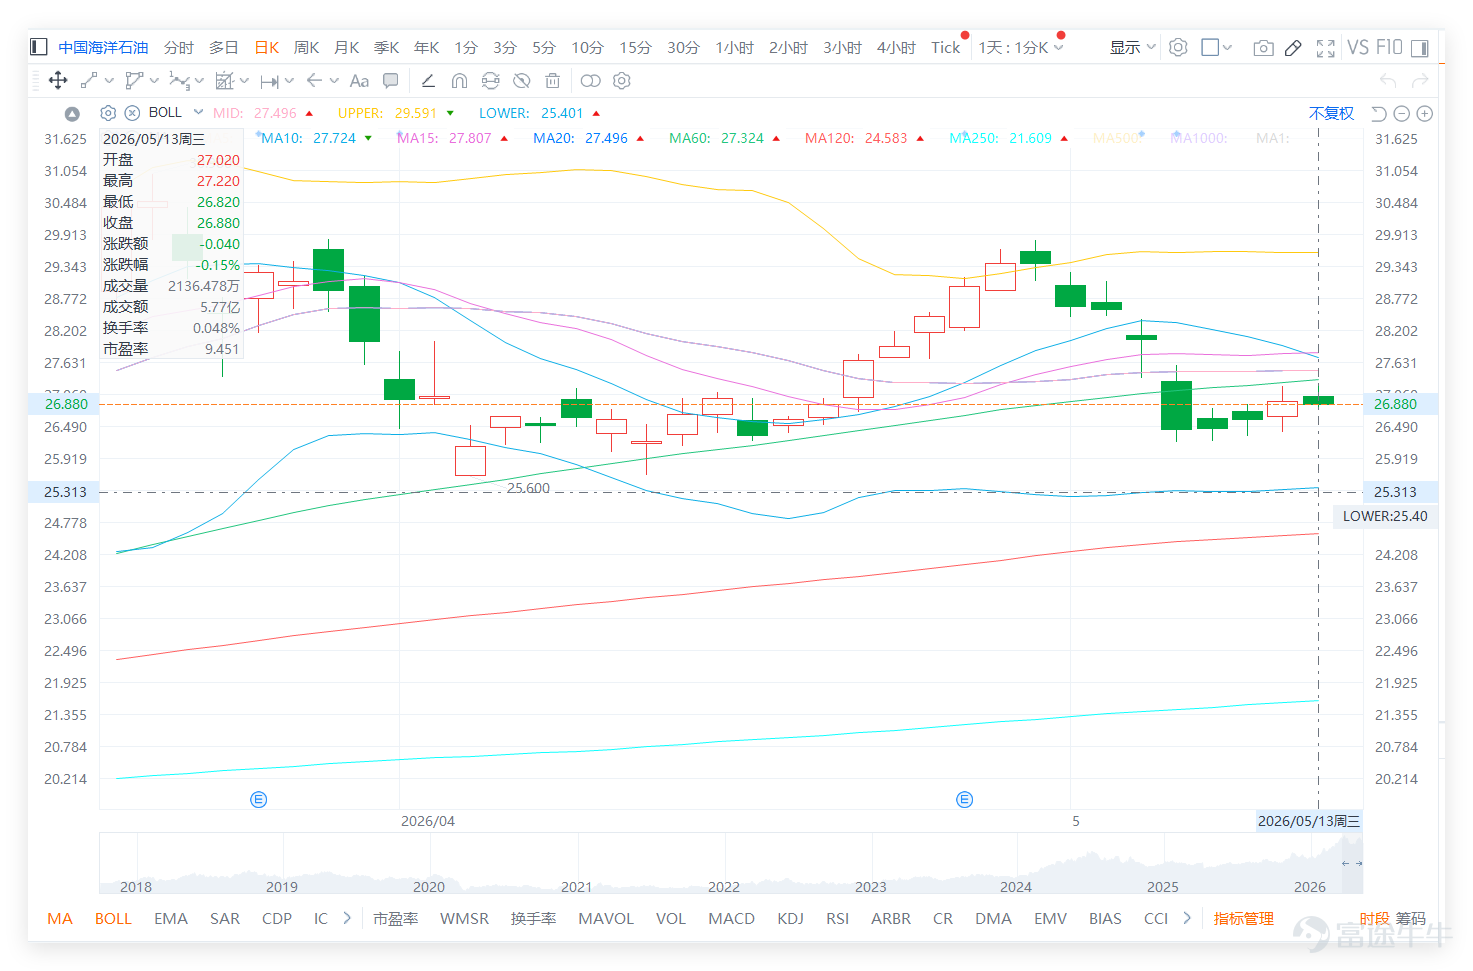
CNOOC's stock price is challenging the dense moving average zone; focus on the key level of 27.3 for contention

The previous day (12th) closed at HKD 26.92, up 1.20% in a single day. Today (13th), the latest quote in the morning was around HKD 26.9, roughly unchanged. Technical indicators show that its trend is relatively strong among the 'three major oil companies'.
$CNOOC (00883.HK)$ The previous day (12th) closed at HKD 26.92, up 1.20% in a single day. Today (13th), the latest quote in the morning was around HKD 26.9, roughly unchanged. Technical indicators show that its trend is relatively strong among the 'three major oil companies'. 1. Key levels and technical signals: The current stock price is between the first support at 25.9 and the first resistance at 28.3. The most critical technical point is that the summary signal from technical indicators clearly shows 'buy', and multiple oscillation indicators such as the Williams %R are in an 'oversold state, buy signal'. This is typically seen as a positive signal for short-term technical rebound. The RSI indicator is at 44, in the neutral to weak region, indicating there is still room for a rebound without entering overbought territory. 2. Moving averages and price structure: The current stock price is slightly below the 10-day (27.93), 30-day (27.49), and 60-day moving averages (27.28), attempting to challenge this dense moving average zone upward. If it can successfully stabilize above 27.3 (the 60-day moving average), the technical pattern will significantly improve. Below, 25.9 is the short-term key support and must be defended. 3. Volume and sector comparison: The previous day’s trading volume was approximately HKD 1.741 billion, with a 5-day volatility of 8%, which is within normal fluctuation levels. The key point is that, within the oil sector, its technical condition is clearly better than its peers. A horizontal comparison of the 'three major oil companies' shows their technical strengths and weaknesses clearly: 1. CNOOC (00883): Technical signal 'buy', RSI 44, trend...
1. Key levels and technical signals: The current stock price is between the first support at 25.9 and the first resistance at 28.3. The most critical technical point is that the summary signal from technical indicators clearly shows 'buy', and multiple oscillation indicators such as the Williams %R are in an 'oversold state, buy signal'. This is typically seen as a positive signal for short-term technical rebound. The RSI indicator is at 44, in the neutral to weak region, indicating there is still room for a rebound without entering overbought territory.
2. Moving Averages and Price Structure: The current stock price is slightly below the 10-day (27.93), 30-day (27.49), and 60-day moving averages (27.28), attempting to move upward to challenge this area of concentrated moving averages. If it can successfully stabilize above 27.3 yuan (the 60-day moving average), the technical pattern will significantly improve. The support level at 25.9 yuan is a short-term critical support that must be maintained.
3. Volume and Sector Comparison: The previous day's trading volume was approximately 1.741 billion, with a 5-day volatility of 8%, which is within the normal range of fluctuation. The key point is that within the oil sector, its technical condition is clearly better than its peers.
A horizontal comparison of the 'Big Three Oil' companies reveals their technical strengths and weaknesses at a glance:
1. CNOOC (00883): Technical signal 'Buy', RSI 44, showing relatively strong momentum and representing the best short-term technical momentum in the sector.
$CNOOC (00883.HK)$ The previous day (12th) closed at HKD 26.92, up 1.20% in a single day. Today (13th), the latest quote in the morning was around HKD 26.9, roughly unchanged. Technical indicators show that its trend is relatively strong among the 'three major oil companies'. 1. Key levels and technical signals: The current stock price is between the first support at 25.9 and the first resistance at 28.3. The most critical technical point is that the summary signal from technical indicators clearly shows 'buy', and multiple oscillation indicators such as the Williams %R are in an 'oversold state, buy signal'. This is typically seen as a positive signal for short-term technical rebound. The RSI indicator is at 44, in the neutral to weak region, indicating there is still room for a rebound without entering overbought territory. 2. Moving averages and price structure: The current stock price is slightly below the 10-day (27.93), 30-day (27.49), and 60-day moving averages (27.28), attempting to challenge this dense moving average zone upward. If it can successfully stabilize above 27.3 (the 60-day moving average), the technical pattern will significantly improve. Below, 25.9 is the short-term key support and must be defended. 3. Volume and sector comparison: The previous day’s trading volume was approximately HKD 1.741 billion, with a 5-day volatility of 8%, which is within normal fluctuation levels. The key point is that, within the oil sector, its technical condition is clearly better than its peers. A horizontal comparison of the 'three major oil companies' shows their technical strengths and weaknesses clearly: 1. CNOOC (00883): Technical signal 'buy', RSI 44, trend...
2、 $PETROCHINA (00857.HK)$: Technical signal 'Sell', RSI 48, showing weak momentum and lacking upward strength.
3、 $SINOPEC CORP (00386.HK)$: Technical signal 'Sell', RSI 47, also facing adjustment pressure and lagging behind in performance.
Simply put, stocks in the oil sector do not rise or fall uniformly. Currently, capital or technical buying clearly favors CNOOC, allowing it to outperform the other two oil giants due to differences in business structure, dividend policy, or sensitivity to oil prices.
Reference for warrant product strategies:
For investors looking to use derivatives to capture its relative strength, consider the features of the following two products:
1. High-leverage call warrants ( ): Exercise price 29.88 yuan, actual leverage about 6.9 times. Its feature is the highest leverage and the lowest implied volatility, making it suitable for those optimistic about a breakout above resistance.$UBCNOOC@EC2609B.C (26708.HK)$): Strike price of RMB 29.88, with an effective leverage of approximately 6.9x. Its key features are the highest leverage and the lowest implied volatility, making it well-suited for investors who anticipate a breakout above the resistance level.
2. High-leverage bull contracts ($UB#CNOOCRC2810E.C (64350.HK)$): Recovery price at $24, with an actual leverage of approximately 10.8 times. Its features include the lowest premium and higher leverage, making it suitable for medium-term bullish strategies that can tolerate recovery risks.
$CNOOC (00883.HK)$ The previous day (12th) closed at HKD 26.92, up 1.20% in a single day. Today (13th), the latest quote in the morning was around HKD 26.9, roughly unchanged. Technical indicators show that its trend is relatively strong among the 'three major oil companies'. 1. Key levels and technical signals: The current stock price is between the first support at 25.9 and the first resistance at 28.3. The most critical technical point is that the summary signal from technical indicators clearly shows 'buy', and multiple oscillation indicators such as the Williams %R are in an 'oversold state, buy signal'. This is typically seen as a positive signal for short-term technical rebound. The RSI indicator is at 44, in the neutral to weak region, indicating there is still room for a rebound without entering overbought territory. 2. Moving averages and price structure: The current stock price is slightly below the 10-day (27.93), 30-day (27.49), and 60-day moving averages (27.28), attempting to challenge this dense moving average zone upward. If it can successfully stabilize above 27.3 (the 60-day moving average), the technical pattern will significantly improve. Below, 25.9 is the short-term key support and must be defended. 3. Volume and sector comparison: The previous day’s trading volume was approximately HKD 1.741 billion, with a 5-day volatility of 8%, which is within normal fluctuation levels. The key point is that, within the oil sector, its technical condition is clearly better than its peers. A horizontal comparison of the 'three major oil companies' shows their technical strengths and weaknesses clearly: 1. CNOOC (00883): Technical signal 'buy', RSI 44, trend...
Important note: Warrants and bull/bear contracts are high-risk derivative products that can rise or fall sharply. Oil stock prices are affected by international oil prices, and volatility may suddenly increase. It is essential to understand their characteristics and risks before investing in related derivatives.
For more market analysis, stay tuned to Jenny's daily updates on 'Hong Kong Stock Warrants'!
Reminder: This article does not constitute any investment advice.
This article is for reference only and does not constitute any investment advice. Market data, opinions, and analysis contained herein may change at any time without prior notice. We are not responsible for any loss or damage caused by reliance on the information in this article. Technical analysis only shows whether certain technical conditions are met; asset performance should be comprehensively evaluated using other sources of information, and trading decisions should not be made solely based on this article. Please note that past performance is not indicative of future results.
#HKStocks #LiveAnalysis #WarrantPick #WarrantGuide #DerivativesHedging #HKWarrantsJenny #CNOOC #OilStocks #TechnicalAnalysis
Risk Disclaimer: The above content only represents the author's view. It does not represent any position or investment advice of Futu. Futu makes no representation or warranty.Read more
99K Views
Report
Comment (1)
Write a Comment...
1