
Tencent (00700) Short-term Technical Analysis: Rebound Brewing in Oversold Zone, Key Support Becomes Critical Turning Point
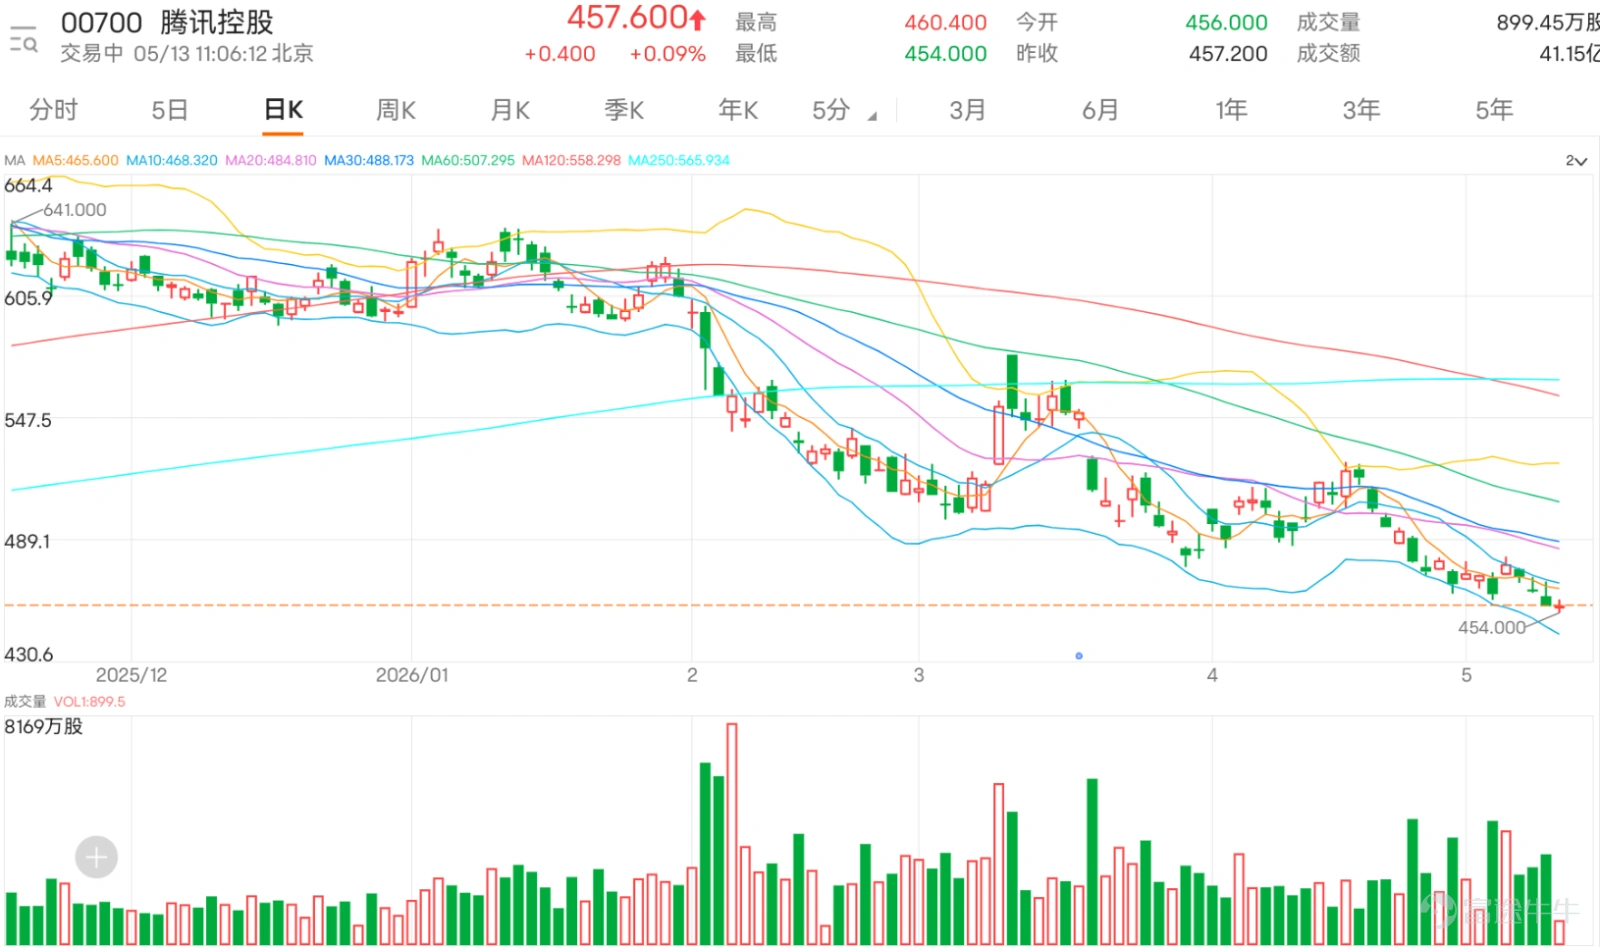
$TENCENT (00700.HK)$ The stock price dropped to 454 yuan during early trading and then stabilized, with the latest quote at 457.6 yuan. The current stock price is further away from the 10-day moving average of 469.94 yuan, and has clearly broken below the 30-day moving average of 489.44 yuan and the 60-day moving average of 509 yuan, presenting a clear bearish pattern.
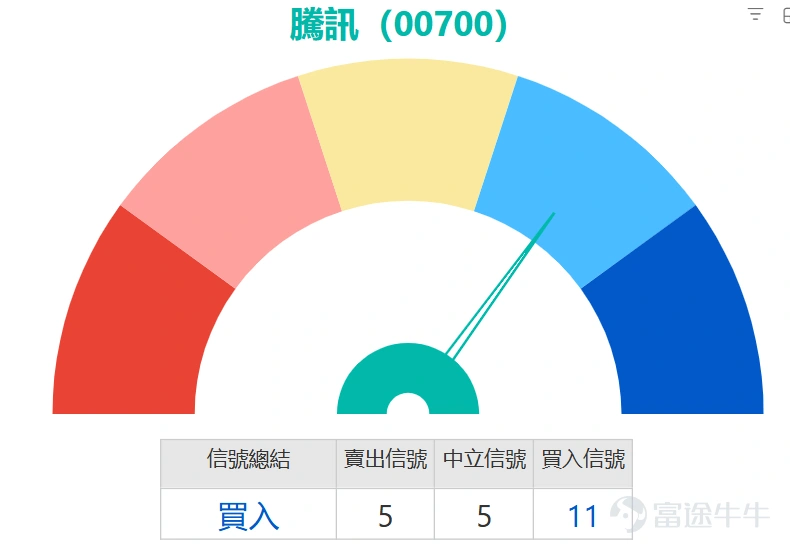
Based on key technical indicators, the stock price is in a short-term oversold condition, with rebound momentum accumulating, but the overall trend has not yet reversed. Both the Stochastic Oscillator (KD) and Relative Strength Index (RSI) are pointing in the same direction. The RSI value is 36, entering the edge of what is traditionally considered an oversold area, suggesting selling pressure may soon weaken. More importantly, the Stochastic Oscillator clearly indicates being in the 'oversold zone' and gives a 'buy' signal, which is usually a leading indicator for short-term rebounds. Additionally, the CCI indicator shows a 'bottom divergence' pattern, also issuing a 'buy' signal, further reinforcing the technical view that downward momentum is weakening and a potential turning point is approaching. The momentum oscillator also suggests 'oversold, possible bottoming, buy.' However, investors must be aware that trend indicators such as MACD, ADX, and Ichimoku Cloud still issue 'sell' signals, indicating medium-term downward pressure remains unresolved, and any rebound may face significant resistance in its early stages.
In summary, the technical picture presents a standoff between 'short-term oversold rebound' and 'medium-term weak trend'. The first important support line is at 449 yuan; if breached, it could lead to further testing of the second support level at 422 yuan. Initial resistance is seen at 481 yuan, which is the first hurdle that needs to be overcome and held for a rebound; stronger resistance lies near 512 yuan, roughly coinciding with the declining 60-day moving average, making it a litmus test for whether the downtrend truly reverses.
In conclusion, Tencent’s current technical chart signals a tactical opportunity. Multiple leading oscillators (such as the Stochastic Oscillator and CCI) collectively issue buy signals in the oversold region, providing a technical basis for short-term 'left-side trading' or 'rebound speculation,' suggesting an increasing probability of a technical rebound in the coming trading days. However, due to major moving averages being in a bearish alignment and multiple trend indicators remaining bearish, any rebound will inevitably face substantial challenges. Strategically, one might consider light positioning for a short-term rebound near the critical support zone of 449-457 yuan, setting an initial rebound target around 481 yuan. Strict risk management is crucial, using a close below 449 yuan as a stop-loss reference, as this could indicate the failure of the short-term rebound logic, leading to a new round of bottom-searching. Under the current market conditions, this represents a probabilistic and odds-based technical deployment rather than a trend reversal towards going long.
Bullish Outlook (Speculating on Rebound or Medium-Term Trend Reversal)
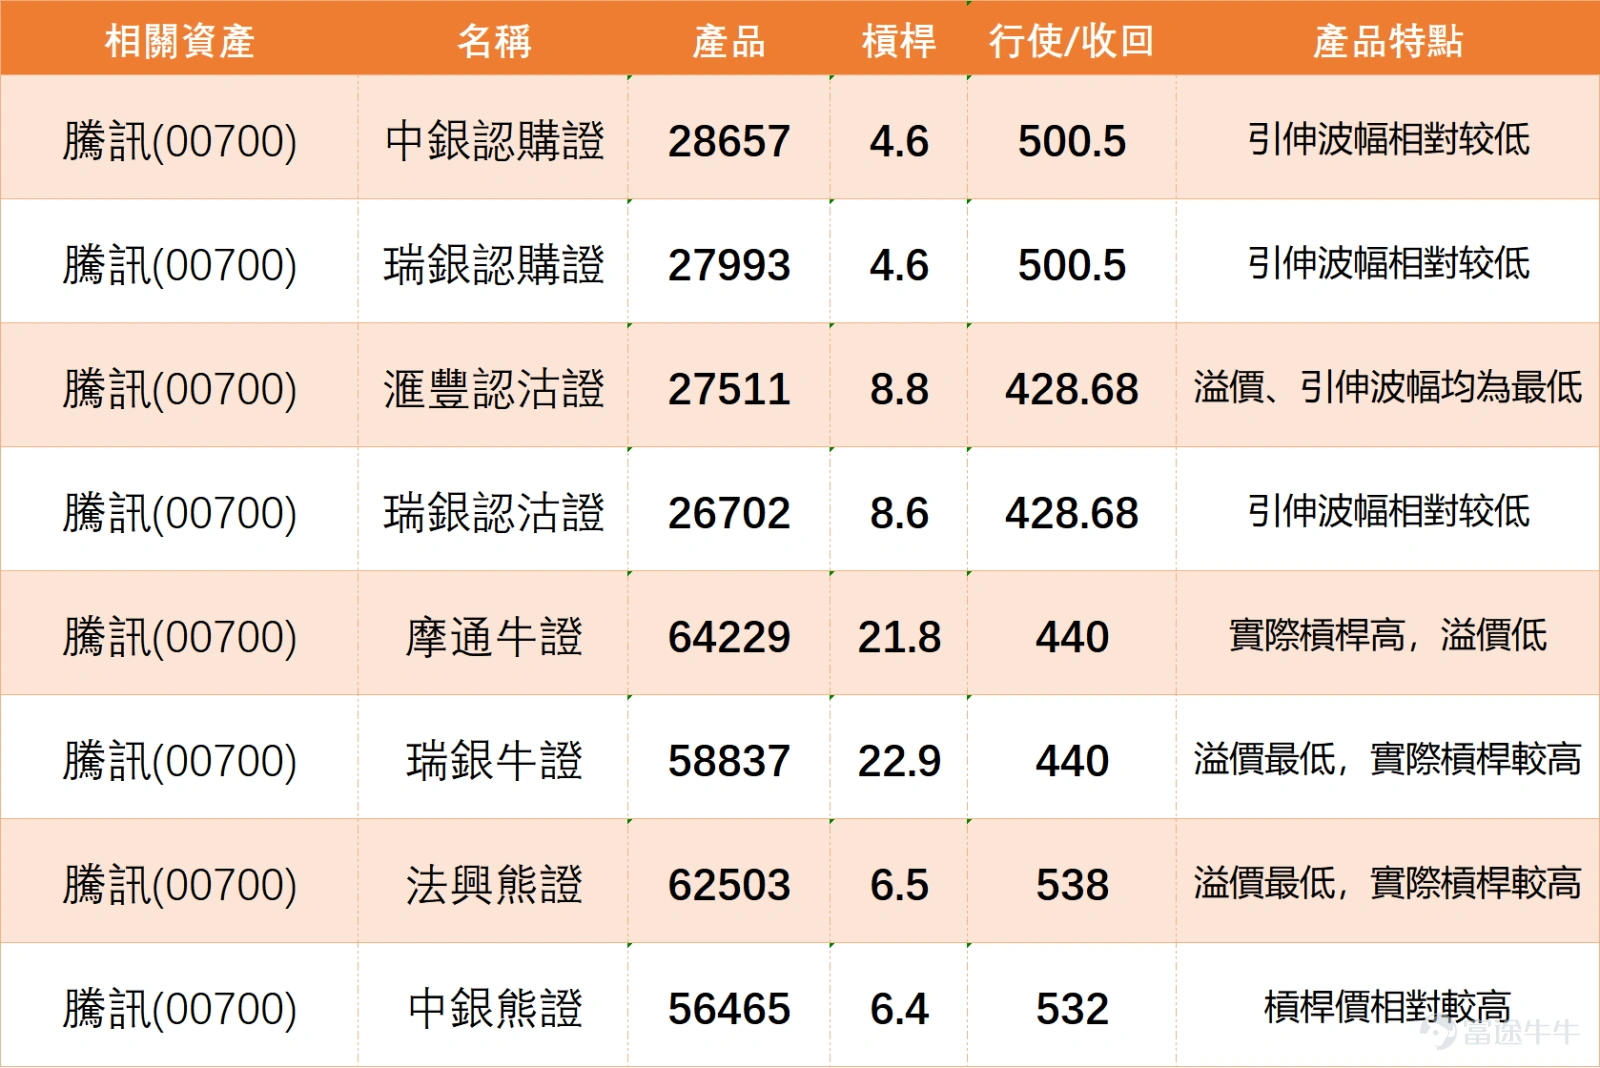
Call warrant selection: Investors may consider $BITENCT@EC2706A.C (28657.HK)$ or $UBTENCT@EC2706A.C (27993.HK)$ . Both have the same exercise price of 500.5 yuan, providing approximately 4.6 times actual leverage. Their key feature is the relatively low implied volatility, which helps reduce time decay and the impact of volatility changes on pricing, potentially offering better cost efficiency when speculating on a rebound. Suitable for investors optimistic about the share price breaking through recent resistance and moving toward the 500-yuan mark.
Bull certificate selection: For investors seeking higher leverage and confident that the stock price will stabilize at critical support levels, they may consider $JP#TENCTRC2609U.C (64229.HK)$ or $UB#TENCTRC2607U.C (58837.HK)$ . Both certificates have a recovery price set at 440 yuan, maintaining a reasonable distance from the 449-yuan key support level mentioned in technical analysis, providing approximately 21 to 23 times higher actual leverage. Among them, UBS bull certificate (58837) has the lowest premium among similar products, while Morgan bull certificate (64229) also has a relatively low premium, meaning tracking error against the underlying stock may be smaller, resulting in higher efficiency. Suitable for aggressive investors who can tolerate higher risks and expect the share price to rebound strongly from current levels.
Bearish direction (pessimistic outlook or hedging risks)
Put warrant selection: Investors may focus on $HSTENCT@EP2608B.P (27511.HK)$ or $UBTENCT@EP2608B.P (26702.HK)$ . Both have an exercise price of 428.68 yuan, providing approximately 8 to 9 times actual leverage. HSBC put warrant (27511) has the lowest premium and implied volatility, making it a lower-cost option for bearish strategies. UBS put warrant (26702) also has relatively low implied volatility. Suitable for investors anticipating that after a rebound, the share price will fall again, potentially breaking below the 449-yuan support level.
Bear certificate selection: If investors are pessimistic about the market outlook and wish to operate with high leverage, they may consider $SG#TENCTRP2812S.P (62503.HK)$ or $BI#TENCTRP2812E.P (56465.HK)$ ). Societe Generale bear certificate (62503) has a recovery price of 538 yuan, the lowest premium, and relatively high actual leverage (approximately 6.5 times). Bank of ** certificate (56465) has a recovery price of 532 yuan, with relatively high leverage (approximately 6.4 times). The recovery prices of both certificates are far above the current share price and recent resistance levels, providing some buffer. Suitable for investors expecting that the rebound will lose momentum, constrained by resistance levels of 481 yuan or 512 yuan, and the downtrend resumes.
Tencent's short-term technical indicators show multiple buy signals, but the medium-term trend remains bearish. Do you think now is suitable for short-term speculation on a rebound, or should we continue to wait for the medium-term trend reversal before entering?
Feel free to share your insights in the comment section. For more market analysis, please continue following ‘Hong Kong Stock Warrants Jenny’ for daily updates!
Reminder: This article does not constitute any investment advice.
This article is for reference only and does not constitute any investment advice. Market data, opinions, and analyses contained herein may change at any time without prior notice. We are not responsible for any loss or damage caused by reliance on the information in this article. Technical analysis only shows whether certain technical conditions are met, and asset performance should be comprehensively evaluated in conjunction with other information. Trading decisions should not be made solely based on this article. Please note that past performance is not indicative of future results. $Hang Seng Index (800000.HK)$$Hang Seng TECH Index (800700.HK)$
#Hong Kong Stocks #Real-time Analysis #Warrant Picks #Warrant Strategies #Derivatives Hedging #HK Warrants Jenny #Tencent #00700 #Blue Chips #Technical Analysis
Risk Disclaimer: The above content only represents the author's view. It does not represent any position or investment advice of Futu. Futu makes no representation or warranty.Read more

Comment (1)
to post a comment
1