English
Back
Open Account
港股窩輪Jenny
wrote a post · May 13 11:02

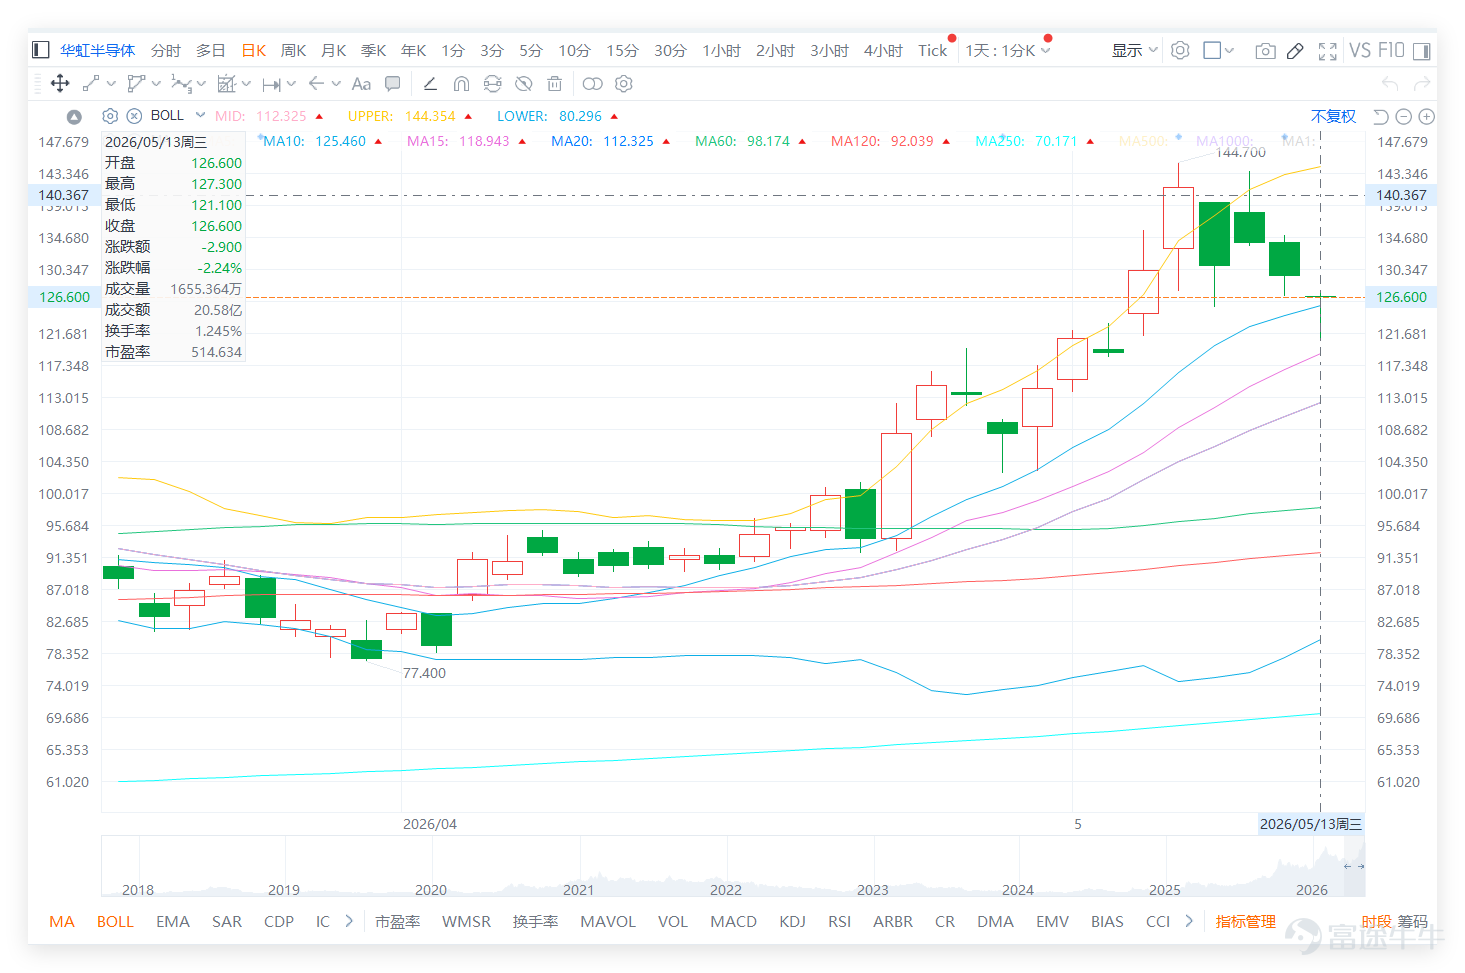
Trend Analysis via Moving Averages: Huahong's stock price is above all moving averages, but short-term indicators show divergence

On the previous day (the 12th), the closing price was HKD 129.5, a single-day drop of 3.36%. Today (the 13th), the latest quote in the morning was approximately HKD 126.6, continuing the downtrend. Technical indicators show that after a recent rapid rise, downward pressure is being released.
$HUA HONG SEMI (01347.HK)$ On the previous day (the 12th), the closing price was HKD 129.5, a single-day drop of 3.36%. Today (the 13th), the latest quote in the morning was approximately HKD 126.6, continuing the downtrend. Technical indicators show that after a recent rapid rise, downward pressure is being released. 1. Key Levels and Overbought Pressure: The current stock price is between the first resistance at 143.4 and the first support at 112.4. The RSI indicator is as high as 68, very close to the overbought warning line of 70. The technical indicator summary signal is 'Sell,' confirming the technical need for a short-term pullback. The stock price fell below the HKD 130 level yesterday, moving closer to the next key support level at 112.4. 2. Moving Averages and Support Structure: The current stock price remains above all major moving averages (MA10: 124.13, MA30: 102.04, MA60: 97.77), indicating that the medium- to long-term upward trend has not been broken. The level of HKD 112.4 is a crucial battleground between bulls and bears, close to the 10-day moving average. If this level is breached, it may test the stronger second support level at HKD 96.9. 3. Volume and High Volatility: Yesterday’s trading volume reached HKD 4.219 billion, with a five-day volatility of 18.1%, both figures being exceptionally high. High trading volume coupled with high volatility indicates intense battles between buyers and sellers in the current range. With the RSI elevated, this kind of high volatility typically signals an impending short-term directional choice. In the narrow sense of the semiconductor manufacturing sector, individual stock technical analysis...
1. Key Levels and Overbought Pressure: The current stock price is between the first resistance at 143.4 and the first support at 112.4. The RSI indicator is as high as 68, very close to the overbought warning line of 70. The technical indicator summary signal is 'Sell,' confirming the technical need for a short-term pullback. The stock price fell below the HKD 130 level yesterday, moving closer to the next key support level at 112.4.
2. Moving Averages and Support Structure: The current stock price remains above all major moving averages (MA10: 124.13, MA30: 102.04, MA60: 97.77), indicating that the medium- to long-term upward trend has not been broken. The level of HKD 112.4 is a crucial battleground between bulls and bears, close to the 10-day moving average. If this level is breached, it may test the stronger second support level at HKD 96.9.
3. Volume and High Volatility: Yesterday's trading volume reached 4.219 billion, with the 5-day volatility hitting 18.1%. Both figures are exceptionally prominent. High trading volume coupled with high volatility indicates fierce contention between bulls and bears in the current range. With the RSI being elevated, this high volatility typically signals that a short-term directional choice is imminent.
In the narrowly defined semiconductor manufacturing sector, technical signals for individual stocks have shown divergence:
1. Hua Hong (01347): RSI 68, technical signal 'Sell', indicating clear short-term downward pressure.
$HUA HONG SEMI (01347.HK)$ On the previous day (the 12th), the closing price was HKD 129.5, a single-day drop of 3.36%. Today (the 13th), the latest quote in the morning was approximately HKD 126.6, continuing the downtrend. Technical indicators show that after a recent rapid rise, downward pressure is being released. 1. Key Levels and Overbought Pressure: The current stock price is between the first resistance at 143.4 and the first support at 112.4. The RSI indicator is as high as 68, very close to the overbought warning line of 70. The technical indicator summary signal is 'Sell,' confirming the technical need for a short-term pullback. The stock price fell below the HKD 130 level yesterday, moving closer to the next key support level at 112.4. 2. Moving Averages and Support Structure: The current stock price remains above all major moving averages (MA10: 124.13, MA30: 102.04, MA60: 97.77), indicating that the medium- to long-term upward trend has not been broken. The level of HKD 112.4 is a crucial battleground between bulls and bears, close to the 10-day moving average. If this level is breached, it may test the stronger second support level at HKD 96.9. 3. Volume and High Volatility: Yesterday’s trading volume reached HKD 4.219 billion, with a five-day volatility of 18.1%, both figures being exceptionally high. High trading volume coupled with high volatility indicates intense battles between buyers and sellers in the current range. With the RSI elevated, this kind of high volatility typically signals an impending short-term directional choice. In the narrow sense of the semiconductor manufacturing sector, individual stock technical analysis...
2、 $SMIC (00981.HK)$ : RSI 66, technical signal 'Neutral'. Although the RSI is also relatively high, its technical condition is slightly more stable than Hua Hong’s, showing that the trends of the two major wafer foundries are not entirely synchronized.
In short: The semiconductor sector as a whole has not formed a unified upward trend. Hua Hong requires consolidation after a sharp rise from a technical perspective, while SMIC remains in a neutral观望 state. The sector overall lacks strong upward momentum.
Reference for warrant product strategies:
When stock prices exhibit high volatility and technical indicators weaken, some investors might use derivatives to capture price swings. The following two products’ characteristics can be studied:
1. High-leverage Bear Certificate ($SG#HUAHORP2812G.P (68083.HK)$ ): Strike price 145, actual leverage approximately 8.4x. Its feature is the lowest premium, making it suitable for those with a bearish short-term outlook who can strictly adhere to stop-loss levels.
2. Low-premium Bull Certificate ( $JP#HUAHORC2610C.C (66055.HK)$ ): Strike price 106, actual leverage approximately 4.9x. Its feature is the highest actual leverage and lowest premium. If optimistic about the medium-to-long-term trend and able to bear the risk of forced recall, it can serve as a rebound play tool.
$HUA HONG SEMI (01347.HK)$ On the previous day (the 12th), the closing price was HKD 129.5, a single-day drop of 3.36%. Today (the 13th), the latest quote in the morning was approximately HKD 126.6, continuing the downtrend. Technical indicators show that after a recent rapid rise, downward pressure is being released. 1. Key Levels and Overbought Pressure: The current stock price is between the first resistance at 143.4 and the first support at 112.4. The RSI indicator is as high as 68, very close to the overbought warning line of 70. The technical indicator summary signal is 'Sell,' confirming the technical need for a short-term pullback. The stock price fell below the HKD 130 level yesterday, moving closer to the next key support level at 112.4. 2. Moving Averages and Support Structure: The current stock price remains above all major moving averages (MA10: 124.13, MA30: 102.04, MA60: 97.77), indicating that the medium- to long-term upward trend has not been broken. The level of HKD 112.4 is a crucial battleground between bulls and bears, close to the 10-day moving average. If this level is breached, it may test the stronger second support level at HKD 96.9. 3. Volume and High Volatility: Yesterday’s trading volume reached HKD 4.219 billion, with a five-day volatility of 18.1%, both figures being exceptionally high. High trading volume coupled with high volatility indicates intense battles between buyers and sellers in the current range. With the RSI elevated, this kind of high volatility typically signals an impending short-term directional choice. In the narrow sense of the semiconductor manufacturing sector, individual stock technical analysis...
Important Note: Warrants and bull/bear certificates are high-risk derivatives whose prices can soar or plummet. In market conditions with extreme volatility (18.1%), the fluctuations and risks of related products increase significantly, as does the risk of forced recall for bull certificates. A careful assessment is essential.
For more market analysis, stay tuned to Jenny's daily updates on 'Hong Kong Stock Warrants'!
Reminder: This article does not constitute any investment advice.
This article is for reference only and does not constitute any investment advice. Market data, opinions, and analysis contained herein may change at any time without prior notice. We are not responsible for any loss or damage caused by reliance on the information in this article. Technical analysis only shows whether certain technical conditions are met; asset performance should be comprehensively evaluated using other sources of information, and trading decisions should not be made solely based on this article. Please note that past performance is not indicative of future results.
#Hong Kong Stocks #Real-time Analysis #Warrants Selection #Warrants Strategy #Derivatives Hedging #Hong Kong Stock Warrants Jenny #Hua Hong Semiconductor #Semiconductor #Technical Analysis
Risk Disclaimer: The above content only represents the author's view. It does not represent any position or investment advice of Futu. Futu makes no representation or warranty.Read more
Thumbs Up
1
76K Views
Report
Comments (4)
Write a Comment...
4
1