English
Back
Open Account
港股窩輪Jenny
wrote a post · May 13 10:43

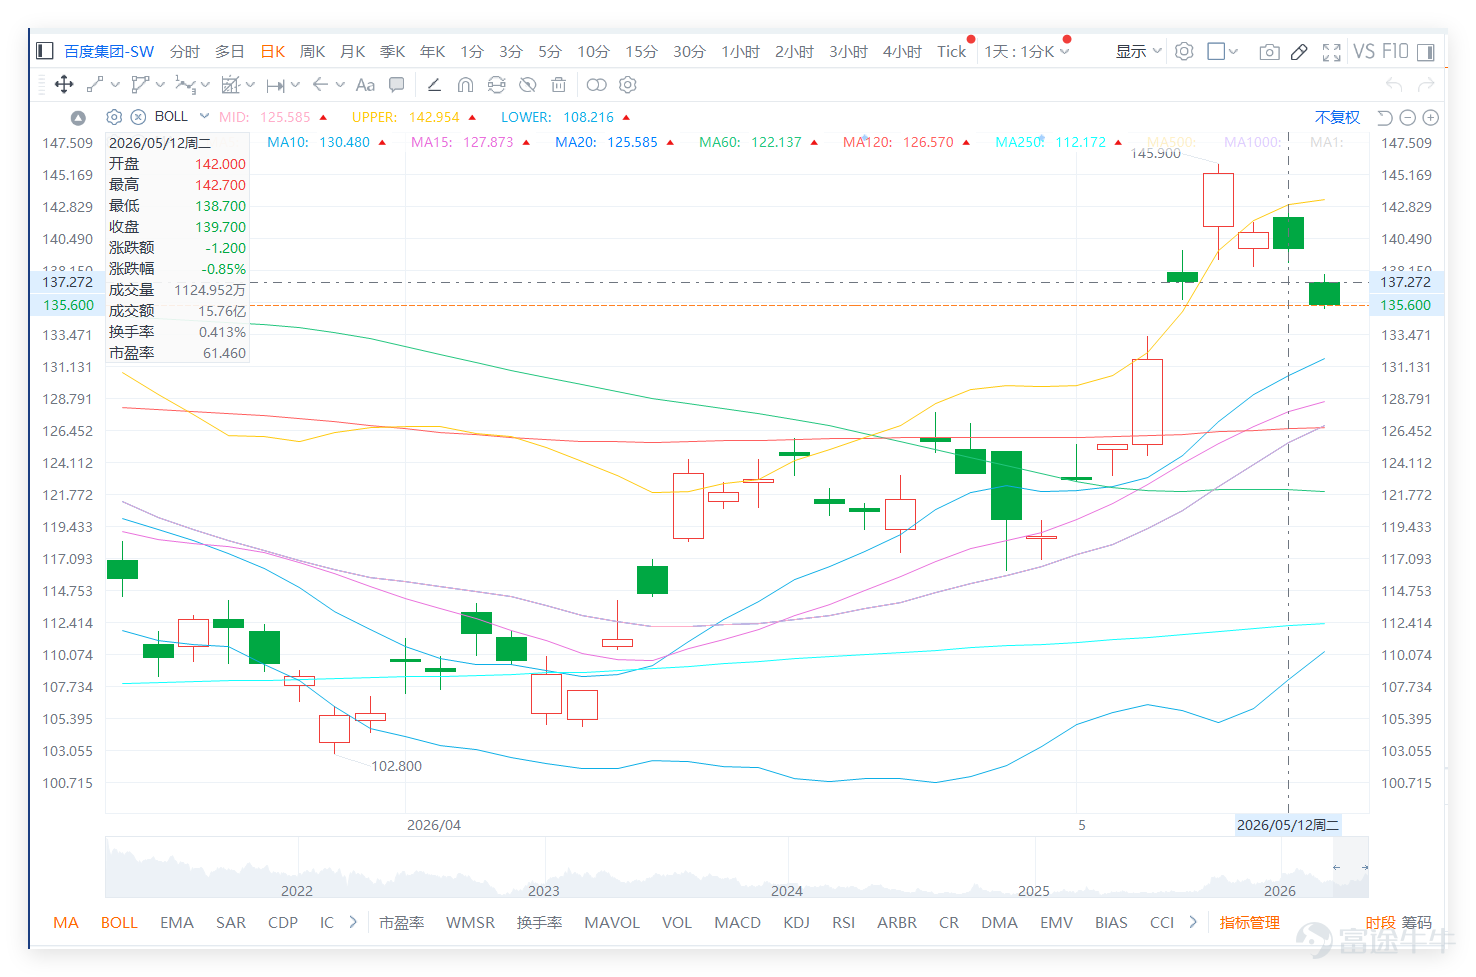
Baidu undergoes technical adjustment, breaks below the 140 mark; short-term defense focuses on 127.7 yuan

The previous day (12th) closed at 139.7 yuan, a slight drop of 0.85% in a single day. However, its technical indicators have sent signals worth noting. On the morning of the 13th, the latest quote was 136.2 yuan, a drop of approximately 2.51%, indicating that adjustment pressure is being released.
$BIDU-SW (09888.HK)$ The previous day (12th) closed at 139.7 yuan, a slight drop of 0.85% in a single day. However, its technical indicators have sent signals worth noting. On the morning of the 13th, the latest quote was 136.2 yuan, a drop of approximately 2.51%, indicating that adjustment pressure is being released. 1. Key levels and overbought signals: The current stock price is between the key resistance level of 148.6 and support level of 127.7. Most notably, the RSI indicator has reached 71, entering the 'overbought' zone (generally above 70) in traditional technical analysis, which is typically an early signal for short-term profit-taking or adjustments. The overall technical indicator summary also shows a 'sell' signal, further confirming downward pressure. 2. Moving averages and support: Currently, the stock price is higher than all major moving averages (MA10: 130.48, MA30: 119.88, MA60: 122.14), indicating that the medium-term trend has not deteriorated. The first support level is at 127.7 yuan, which is close to the 10-day moving average, making it an important short-term observation point. If it falls below this, stronger second support at 118.1 yuan should be closely monitored. 3. Volume and volatility: The previous day’s trading volume was about 1.576 billion yuan, with a 5-day volatility range reaching 15.2%, showing significant recent fluctuations. In the context of an overbought RSI, higher volatility means increased short-term fluctuation risks, and investors need to pay attention to market rhythm. Within the tech sector, individual stock technical signals are clearly diverging, and Baidu is one of the few showing a 'sell'...
1. Key levels and overbought signals: The current stock price is between the key resistance level of 148.6 and support level of 127.7. Most notably, the RSI indicator has reached 71, entering the 'overbought' zone (generally above 70) in traditional technical analysis, which is typically an early signal for short-term profit-taking or adjustments. The overall technical indicator summary also shows a 'sell' signal, further confirming downward pressure.
2. Moving averages and support: Currently, the stock price is higher than all major moving averages (MA10: 130.48, MA30: 119.88, MA60: 122.14), indicating that the medium-term trend has not deteriorated. The first support level is at 127.7 yuan, which is close to the 10-day moving average, making it an important short-term observation point. If it falls below this, stronger second support at 118.1 yuan should be closely monitored.
3. Volume and Volatility: The previous day's trading volume was approximately 1.576 billion, with a 5-day volatility of 15.2%, indicating significant recent fluctuations. Against the backdrop of RSI overbought conditions, higher volatility implies increased short-term fluctuation risks, and investors should pay attention to the rhythm.
Within the technology sector, there is a clear divergence in individual stock technical signals; Baidu is one of the few stocks showing a 'sell' signal:
1. Strong Signal (Buy): $TENCENT (00700.HK)$ : RSI 36, technical signal 'buy', currently in a healthy pullback state. $MEITUAN-W (03690.HK)$ : RSI 54, technical signal 'buy', trend remains stable.
1. Neutral Signal: $BABA-W (09988.HK)$ : RSI 54, signal 'neutral', trend remains steady. $KUAISHOU-W (01024.HK)$ : RSI 67, signal 'neutral', but approaching overbought levels.
2. Weak Signal (Sell): $JD-SW (09618.HK)$ : RSI 56, signal 'sell'. $NTES-S (09999.HK)$RSI 54, signal "Sell". Baidu (09888): RSI 71, signal "Sell", one of the stocks showing the most obvious signs of being overbought within the sector.
$BIDU-SW (09888.HK)$ The previous day (12th) closed at 139.7 yuan, a slight drop of 0.85% in a single day. However, its technical indicators have sent signals worth noting. On the morning of the 13th, the latest quote was 136.2 yuan, a drop of approximately 2.51%, indicating that adjustment pressure is being released. 1. Key levels and overbought signals: The current stock price is between the key resistance level of 148.6 and support level of 127.7. Most notably, the RSI indicator has reached 71, entering the 'overbought' zone (generally above 70) in traditional technical analysis, which is typically an early signal for short-term profit-taking or adjustments. The overall technical indicator summary also shows a 'sell' signal, further confirming downward pressure. 2. Moving averages and support: Currently, the stock price is higher than all major moving averages (MA10: 130.48, MA30: 119.88, MA60: 122.14), indicating that the medium-term trend has not deteriorated. The first support level is at 127.7 yuan, which is close to the 10-day moving average, making it an important short-term observation point. If it falls below this, stronger second support at 118.1 yuan should be closely monitored. 3. Volume and volatility: The previous day’s trading volume was about 1.576 billion yuan, with a 5-day volatility range reaching 15.2%, showing significant recent fluctuations. In the context of an overbought RSI, higher volatility means increased short-term fluctuation risks, and investors need to pay attention to market rhythm. Within the tech sector, individual stock technical signals are clearly diverging, and Baidu is one of the few showing a 'sell'...
In simple terms: Not all technology stocks rise or fall uniformly. Baidu, JD.com, and NetEase are in the "sell" camp, while Tencent and Meituan are seeing some capital inflow. This could indicate that funds within the sector are rotating between high and low performers.
Reference for warrant product strategies:
When stock price volatility increases and overbought signals appear, some investors may use derivatives to manage risk. The characteristics of the following two products can be studied:
1. High-leverage Bear Certificate ($JP#BAIDURP2812A.P (58332.HK)$): Strike price 152 yuan, actual leverage approximately 11.2 times. Its feature is the highest actual leverage, suitable for bearish short-term outlooks with strict stop-loss discipline.
2. Call warrant with the lowest implied volatility ($UBBAIDU@EC2609A.C (28166.HK)$): Exercise price 140 yuan, actual leverage approximately 4.4 times. Its feature is the lowest implied volatility; if betting on a rebound, the impact of time decay might be relatively smaller.
$BIDU-SW (09888.HK)$ The previous day (12th) closed at 139.7 yuan, a slight drop of 0.85% in a single day. However, its technical indicators have sent signals worth noting. On the morning of the 13th, the latest quote was 136.2 yuan, a drop of approximately 2.51%, indicating that adjustment pressure is being released. 1. Key levels and overbought signals: The current stock price is between the key resistance level of 148.6 and support level of 127.7. Most notably, the RSI indicator has reached 71, entering the 'overbought' zone (generally above 70) in traditional technical analysis, which is typically an early signal for short-term profit-taking or adjustments. The overall technical indicator summary also shows a 'sell' signal, further confirming downward pressure. 2. Moving averages and support: Currently, the stock price is higher than all major moving averages (MA10: 130.48, MA30: 119.88, MA60: 122.14), indicating that the medium-term trend has not deteriorated. The first support level is at 127.7 yuan, which is close to the 10-day moving average, making it an important short-term observation point. If it falls below this, stronger second support at 118.1 yuan should be closely monitored. 3. Volume and volatility: The previous day’s trading volume was about 1.576 billion yuan, with a 5-day volatility range reaching 15.2%, showing significant recent fluctuations. In the context of an overbought RSI, higher volatility means increased short-term fluctuation risks, and investors need to pay attention to market rhythm. Within the tech sector, individual stock technical signals are clearly diverging, and Baidu is one of the few showing a 'sell'...
Important Note: Bull and bear contracts are high-risk derivative products, which can surge or plunge rapidly. In market conditions where the RSI is overbought and stock price volatility could increase significantly, the risks associated with such products are extremely high. Be sure to understand the product characteristics and forced recovery risks before investing.
For more market analysis, stay tuned to Jenny's daily updates on 'Hong Kong Stock Warrants'!
Reminder: This article does not constitute any investment advice.
This article is for reference only and does not constitute any investment advice. Market data, opinions, and analysis contained herein may change at any time without prior notice. We are not responsible for any loss or damage caused by reliance on the information in this article. Technical analysis only shows whether certain technical conditions are met; asset performance should be comprehensively evaluated using other sources of information, and trading decisions should not be made solely based on this article. Please note that past performance is not indicative of future results.
#HKStocks #LiveAnalysis #WarrantPick #WarrantGuide #DerivativesHedging #HKWarrantsJenny #Baidu #TechStocks #TechnicalAnalysis
Risk Disclaimer: The above content only represents the author's view. It does not represent any position or investment advice of Futu. Futu makes no representation or warranty.Read more
176K Views
Report
Comments (3)
Write a Comment...
3