Alibaba's performance is soft ahead of earnings, key battle to determine bullish or bearish direction
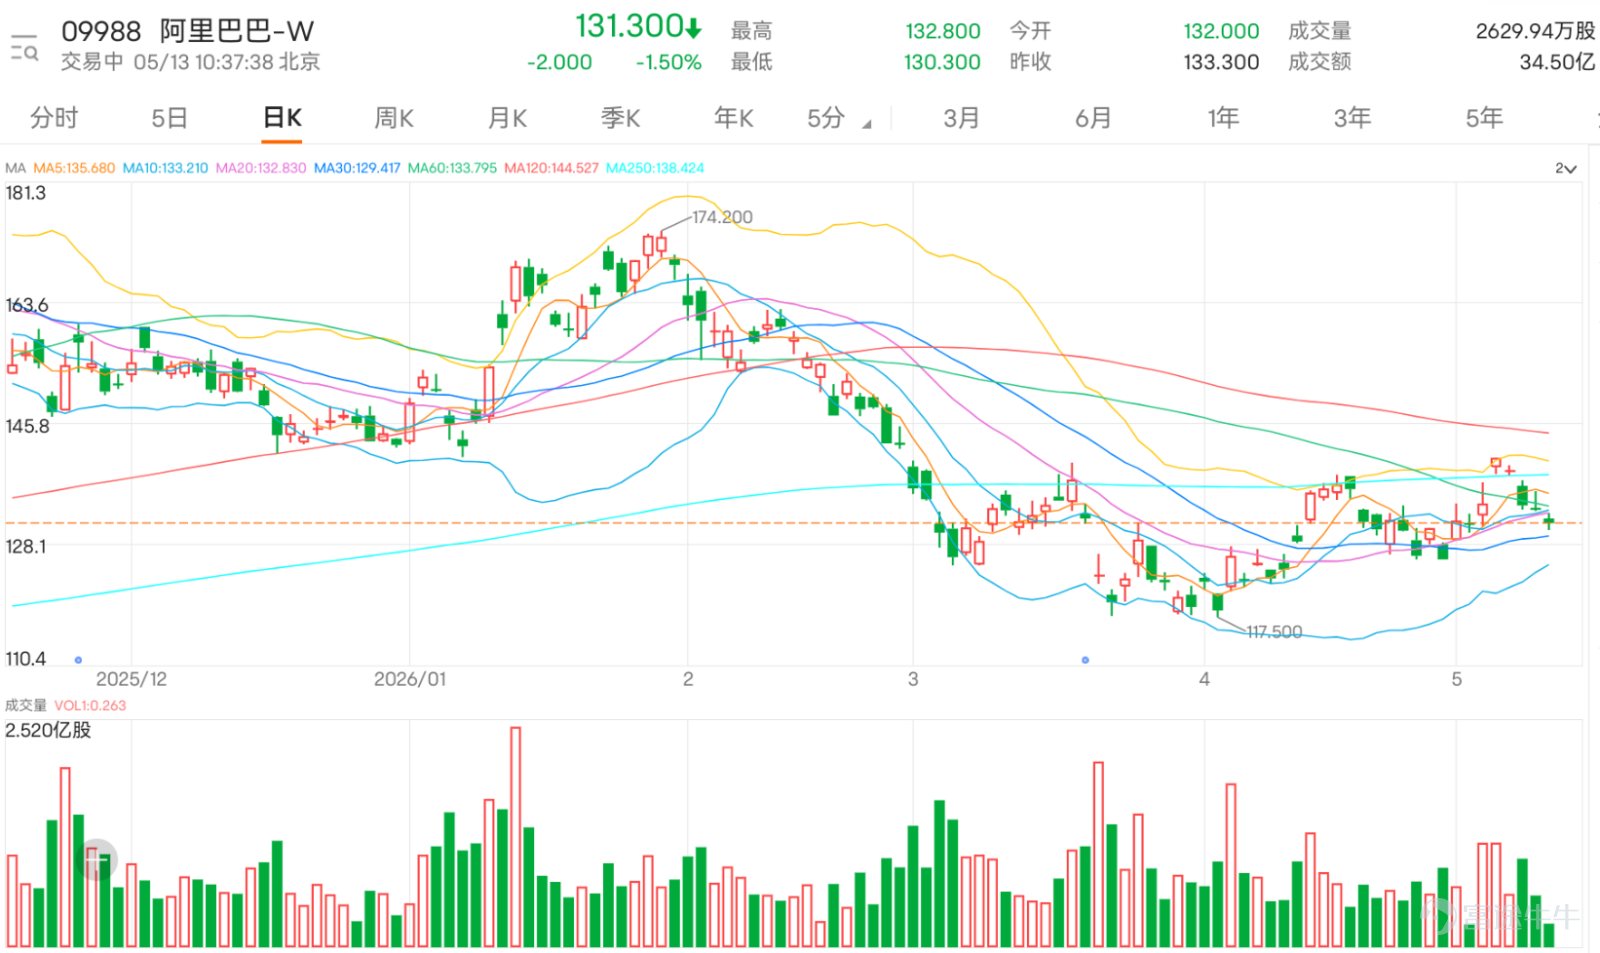
The focus of the Hong Kong stock market today undoubtedly lies on the tech giant $BABA-W (09988.HK)$ . The company will announce its Q4 results for the fiscal year ending March this year and full-year results for the 2026 fiscal year after the market closes. Market sentiment has become cautious, with the latest price at HKD 131.3, possibly indicating that investors are awaiting guidance from the earnings report to decide their next move.
From the current trend, the stock price is struggling near the short-term moving averages. Currently, the stock price remains below the 10-day line (MA10) at HKD 133.15 and the 60-day line (MA60) at HKD 134.24, while the 30-day line (MA30) provides support below at HKD 129.14. The overall moving average system shows entanglement, reflecting unclear mid-term and short-term trend directions, waiting for new catalysts to break through the current range.
Based on a series of key technical indicators, the current status is neutral with观望 (wait-and-see). The Relative Strength Index (RSI), which reflects momentum, is at the 54 level, within the neutral range. Multiple oscillation indicators, including the Stochastic Oscillator (KDJ) and Williams %R, also show neutral signals, indicating that the stock price lacks clear unilateral momentum. The Commodity Channel Index (CCI) is also neutral, further confirming that the stock price is in a range-bound pattern.
However, among numerous neutral signals, some leading indicators have shown subtle changes. The Momentum Oscillator (MTM) and Rate of Change (ROC) indicators have issued 'buy' signals, hinting that potential momentum may be building up. Meanwhile, the Bull/Bear Power Indicator and Ichimoku Cloud analysis are leaning towards positive signs, bringing a glimmer of hope for future performance. Nevertheless, the Average Directional Index (ADX) shows that the current trend strength is not strong, while the Moving Average Convergence Divergence (MACD) remains in a 'sell' signal, indicating that medium-term adjustment pressure has not been fully alleviated. This contradiction in technical signals is a typical representation of uncertainty before earnings.
In summary of technical analysis, the key price levels for Alibaba in the short term have become clear. The primary resistance level is at 138.9 yuan; if this level can be broken through, the stock will likely challenge the secondary resistance at 142.5 yuan. On the downside, the immediate support level is located at 128.6 yuan, with a more critical secondary support at 124.1 yuan. The stock's five-day volatility has reached 7.5%, indicating market volatility and providing space for short-term trading.
Bloomberg’s consolidated market forecast data shows that revenue for the fourth fiscal quarter is projected to be approximately 247.1 billion yuan (RMB), representing a 4.5% year-over-year increase. Adjusted net profit is expected to reach 14.46 billion yuan, reflecting a 51.6% year-over-year decline. For the full year, revenue growth is projected to reach 1.028 trillion yuan, with a 3.2% year-over-year increase, while adjusted net profit is anticipated to hit 77.564 billion yuan, a 50.9% year-over-year drop.
In conclusion, Alibaba is currently in a typical 'wait-and-see' pattern ahead of its earnings announcement. Although technical indicators overall remain 'neutral,' certain momentum indicators have already hinted at potential turning points. The current share price is moving through the moving average system, fluctuating within the range of about 128.6 to 138.9 yuan.
For professional investors, now is not the time to place heavy bets prematurely. A better strategy is to patiently wait for the market’s reaction after the earnings announcement. If results exceed expectations and push the stock price strongly above the 138.9 yuan resistance level, it can be considered a confirmation signal of strengthening trends. At that point, one can follow up by combining improved technical indicators. Conversely, if the results disappoint the market, causing the stock price to break below 128.6 yuan and continue falling, one must be wary of the risk of deeper adjustments. The key is to let the market’s verdict on the earnings guide the direction and strictly base trading decisions on subsequent breakouts or breakdowns of key price levels.


Regarding call warrants, consider $BIALIBA@EC2608E.C (26562.HK)$ , with an exercise price of 150.09 yuan. Its premium and implied volatility are the lowest among similar products, suitable for investors who are optimistic about the outlook and wish to deploy a breakout strategy at a lower cost. Another option is $HSALIBA@EC2608F.C (26604.HK)$ , also with an exercise price of 150.09 yuan. Its relatively low implied volatility reduces the impact of volatility on pricing, making it suitable for medium-term deployment based on optimism about Alibaba's post-earnings performance.
As for put warrants, $MSALIBA@EP2609B.P (27282.HK)$The strike price is 109.9 yuan, with the lowest implied volatility and higher leverage, making it suitable for investors who are bearish on the market outlook and wish to hedge risks at a lower volatility cost.$UBALIBA@EP2609C.P (27125.HK)$The strike price is also 109.9 yuan, with both the premium and implied volatility being the lowest; it has strong defensive characteristics and suits cautious bearish strategies focused on cost-effectiveness.
On the bull certificate side,$SG#ALIBARC2703C.C (60164.HK)$The recovery price is 120 yuan, offering relatively high leverage, which makes it suitable for aggressive investors with a bullish outlook.$UB#ALIBARC2608G.C (54591.HK)$The recovery price is 115 yuan, with the lowest premium and relatively high actual leverage, making it suitable for short-term strategies that expect Alibaba to rebound after holding support levels.
On the bear certificate side,$HS#ALIBARP2811C.P (64493.HK)$The recovery price is 155 yuan, offering high actual leverage and low premium, suitable for investors who are bearish on Alibaba's performance and anticipate a pullback after resistance.$JP#ALIBARP2809J.P (57970.HK)$The recovery price is 149 yuan, offering the highest actual leverage and the lowest premium, suitable for more aggressive bearish positions expecting limited upside in stock price.

1. The current trend for Hong Kong’s tech sector as a whole is weak. Do you think Alibaba’s earnings performance will drive further movement in the tech sector? After the earnings announcement, do you think the stock price will break above the 134 yuan resistance or fall below the 129 yuan support? Feel free to share your insights in the comments section. For more market analysis, stay tuned to 'Hong Kong Warrant Jenny' for daily updates!
Reminder: This article does not constitute any investment advice.
This article is for reference only and does not constitute any investment advice. Market data, opinions, and analysis contained herein may change at any time without prior notice. We are not responsible for any loss or damage caused by reliance on the information in this article. Technical analysis only shows whether certain technical conditions are met; asset performance should be comprehensively evaluated using other sources of information, and trading decisions should not be made solely based on this article. Please note that past performance is not indicative of future results.
#HKStocks #LiveAnalysis #WarrantPick #WarrantGuide #DerivativesHedging #HKWarrantsJenny #Alibaba #09988 #BlueChipStock #TechnicalAnalysis$Hang Seng Index (800000.HK)$$Hang Seng TECH Index (800700.HK)$
Risk Disclaimer: The above content only represents the author's view. It does not represent any position or investment advice of Futu. Futu makes no representation or warranty.Read more
Comment (1)
to post a comment