Zijin Mining's technical outlook is "neutral," with 36.8 yuan becoming the key battleground for buyers and sellers.
On the previous day (12th), $ZIJIN MINING (02899.HK)$
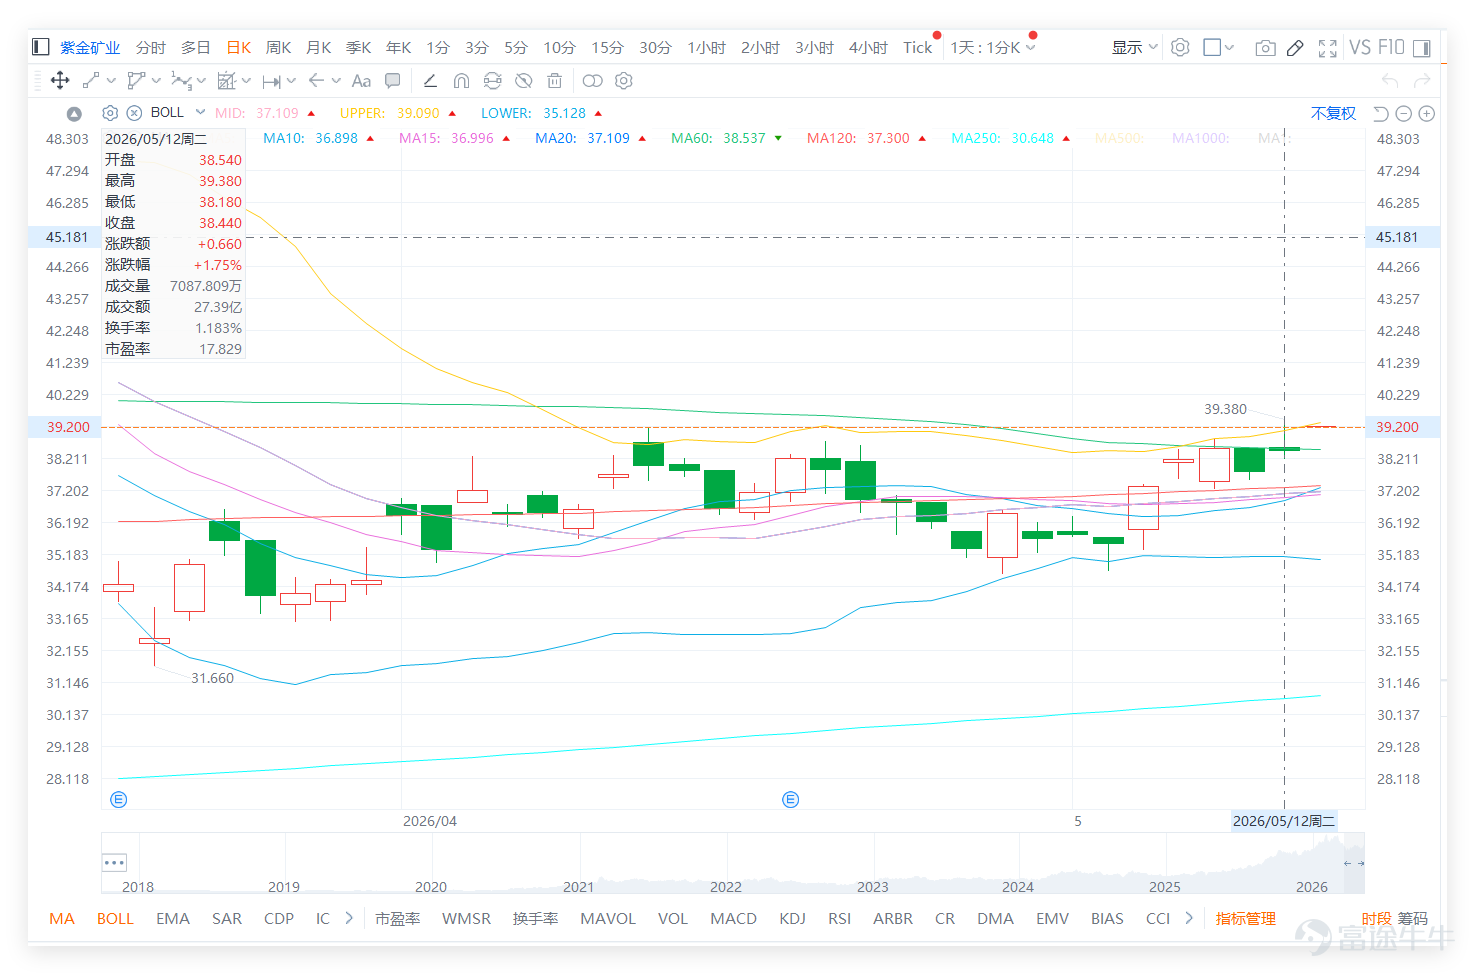
The stock closed at 38.44 yuan, up 1.75% for the day. From a technical indicator perspective, it is currently in an observation period of balanced buying and selling pressure.

1. Key levels and moving averages: The stock price is currently between the first support level at 36.8 yuan and the first resistance level at 39.9 yuan. The area above 39.9 to 41.4 forms a strong resistance zone. Below, the 10-day moving average (approximately 36.9) and the 30-day moving average (approximately 36.57) converge near the 36.8 support level, forming short-term key support. Simply put, holding above the critical support at 36.8 means the structure has not weakened.
2. Momentum indicators: MACD is showing a "buy" signal, but the momentum bars need to expand further. RSI is at 59, indicating a neutral-to-strong condition without entering overbought territory, meaning there is still room for upward movement, but confirmation from trading volume is required. Currently, multiple oscillation indicators such as the Williams %R and Stochastic Oscillator show "neutral" or "overbought conditions," reflecting that the stock may enter a consolidation phase in the short term.
3. Volume and pattern: (On the 12th), the full-day trading volume was approximately 2.739 billion yuan, which is around the recent average, showing no significant anomalies. The stock recorded volatility of about 10.5% within five days, indicating fierce contention between buyers and sellers at current levels. Overall, it shows a range-bound trading pattern with "pressure above and support below."
As a leading company in its sector, Zijin Mining’s "neutral" signal is noteworthy. Comparing technical positions of peers might provide clearer clues on capital rotation:

1、 $ZHAOJIN MINING (01818.HK)$ : Clear "buy" technical signal with RSI at 45, relatively low compared to Zijin Mining, offering more rebound potential and making it one of the more technically positive members in the sector.
2、 $CHALCO (02600.HK)$ And, $CHINAHONGQIAO (01378.HK)$ : Both have an RSI of 41, signaling "buy," positioned at lower levels, possibly with catch-up potential, suitable as a defensive counterattack choice.
3、 $CHIFENG GOLD (06693.HK)$ : Signal is "neutral" but with a 5-day range as high as 23%, showing significant volatility, ideal for short-term swing traders; general investors should be mindful of timing.
Reference for warrant product strategies:
For investors looking to use derivatives to capture volatility, consider the following features of two products:
1. High-leverage call warrants $SGZIJIN@EC2612A.C (25525.HK)$ : Strike price of 46.1 yuan, with an actual leverage of approximately 4.1 times. Its characteristics include a relatively high leverage level among similar products, and implied volatility and premium are relatively low.
2. High-leverage Bear Certificate$UB#ZIJINRP2812I.P (57819.HK)$ : Recovery price of 42 yuan, with an actual leverage of approximately 10.1 times. Its features include low premium and higher leverage, making it suitable for investors who expect short-term downward movements and strictly adhere to stop-loss strategies.

Important Reminder: Warrants and bull/bear certificates are high-risk derivative products that can rise or fall sharply. Before investing, it is essential to understand the product's features, implied volatility, mandatory recovery risks, and set strict stop-loss measures.
For more market analysis, stay tuned to Jenny's daily updates on 'Hong Kong Stock Warrants'!
Reminder: This article does not constitute any investment advice.
This article is for reference only and does not constitute any investment advice. Market data, opinions, and analysis contained herein may change at any time without prior notice. We are not responsible for any loss or damage caused by reliance on the information in this article. Technical analysis only shows whether certain technical conditions are met; asset performance should be comprehensively evaluated using other sources of information, and trading decisions should not be made solely based on this article. Please note that past performance is not indicative of future results.
#HKStocks #RealTimeAnalysis #WarrantPicks #WarrantStrategy #DerivativesHedging #HKWarrantsJenny #ZijinMining #ResourceStocks #TechnicalAnalysis
Risk Disclaimer: The above content only represents the author's view. It does not represent any position or investment advice of Futu. Futu makes no representation or warranty.Read more

Comments
to post a comment
1