
AI agents ignite CPU demand! Who are the big winners?
Niuniu Tech Insights | Intel Surges 50% in 10 Days! In-depth Analysis of Tesla and NVIDIA's Strong Uptrends
Hello fellow investors, welcome to the latest episode of 'Investor Technical Insights'!
On Monday (May 11), US stocks collectively rallied driven by technology and chip stocks, with both the S&P 500 Index and Nasdaq Composite closing at record highs. Among them, $NVIDIA (NVDA.US)$hit a new intraday high,closing up approximately 1.9% at $219.44; $Tesla (TSLA.US)$ rose about 3.9% to $445; $Intel (INTC.US)$ continued its recent strong performance.
NVIDIA (NVDA)

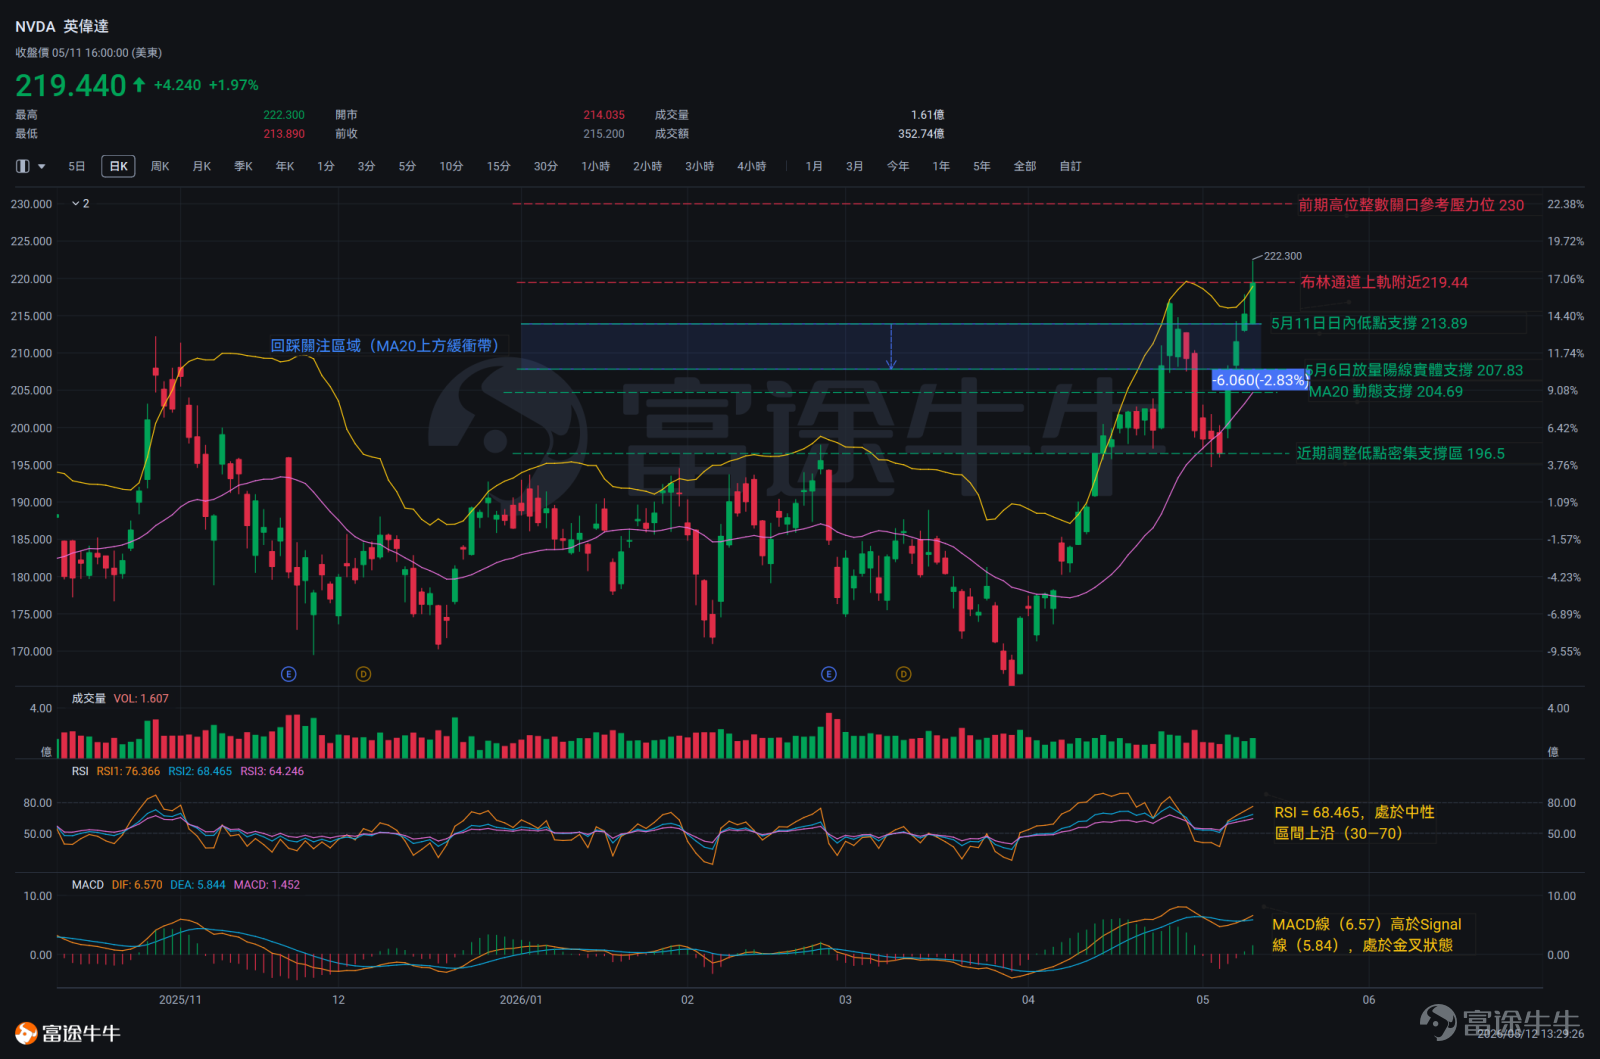
NVIDIA’s overall trend remains upward. From May 6 to May 11, the stock rose for five consecutive trading days, with prices climbing from around $196.50 to close at $219.44 on May 11.
To understand NVIDIA's current price movement, one must start from the end of the bearish candle on May 5. Before that, NVIDIA had fallen for five consecutive days (April 29 to May 5), dropping from $209.25 to $196.50, as buying pressure failed to mount effectively, with daily closes consistently lower than the previous day.
May 6 marked the true starting point of this round of market activity.The stock opened at $199.89 that day, reaching an intraday high of $208.27 and finally closing at $207.83 — the body of this bullish candle (the distance from open to close, approximately $7.94) fully covered the entire body of the bearish candle from May 5.This pattern is commonly referred to as a 'Bullish Engulfing' pattern: a large bullish candle completely 'swallows' the previous day's bearish candle, indicating that buying pressure reversed the prior selling momentum during the day.
The subsequent four days confirmed this assessment. On May 7, it closed at $211.50, on May 8 at $215.20, and on May 11 at $219.44.Four consecutive bullish candles appeared, with each day’s closing price higher than the previous day’s. Additionally, each day’s opening occurred within the body range of the previous day’s candle, without any unstable price gaps followed by pullbacks.Technically, this pattern is referred to as 'Three White Soldiers Extension' — a steady and orderly upward push in price rather than a one-day violent surge.
Special attention should be paid to the K-line for May 11 itself.On that day, the price surged to a high of $222.30 but retreated to close at $219.44, forming an upper shadow of about $2.86 (from the highest point to the closing price). The length of the upper shadow accounts for approximately 53% of the day’s body ($5.40). Objectively, the retreat after the intraday spike near $222.30 indicates the presence of sell orders around that level.Whether the price can effectively stabilize and break through this level will be the most critical observation point in the short term.
Key Technical Indicators Interpretation
Moving Average (MA):The price is approximately $14.75 higher than the MA20 and about $29.95 above the MA50. Both lines are sloping upwards, with the gap between them widening, indicating a healthy moving average structure.
Relative Strength Index (RSI) (68.465):The normal range is between 30 and 70, with values above 70 typically considered an overbought warning. Since the early-May low, as the price has risen, the RSI has also increased without showing divergence — where 'price makes a new high but RSI moves lower' — which is a strong signal of trend exhaustion once it appears.
Moving Average Convergence Divergence (MACD) (6.57):The signal line is at 5.844; the MACD line is above the signal line, forming a 'golden cross,' both lines are above the zero axis, and the momentum histogram is positive and continuously expanding. These three conditions being met simultaneously indicate that short-term momentum is strengthening.
Bollinger Bands:The upper band is at 218.92, and the middle band is at 204.69. The price at 219.44 has slightly broken through the upper band, with the channel in an expansion phase. This expansion indicates a trending market rather than a range-bound one, but when the price runs near the upper band, it usually faces short-term pressure to revert towards the middle band (204.69).
Technical Comprehensive Analysis
NVIDIA’s moving average structure, MACD golden cross, bullish engulfing pattern combined with the 'Three White Soldiers' formation — all four signals align in the same direction.The intermediate-term uptrend shows strong bullish momentum.From a technical analysis perspective, short-term risk factors to watch include: pressure near the upper Bollinger Band, RSI approaching overbought levels, and intraday rejection at the upper shadow.Key focus should be on whether the recent upward trend can continue; if a pullback begins with reduced volume, attention should be paid to whether the $207.83 level (the starting point of this rally) holds firm.
Tesla (TSLA)

Tesla's recent performance has been extremely strong. Over the past 10 trading sessions, its closing price surged unilaterally from $372.80 to $445.00 (with a gain of approximately 3.9% on May 11), representing a cumulative increase of nearly 19.4%.
Tesla's current price movement needs to be analyzed in three phases.In the first phase,Tesla dropped to near $370 during the session on April 29 but rebounded on April 30, opening at $368.17 and closing at $381.63,recovering substantial losses. The close of this bullish candle exceeded the midpoint of the previous day’s bearish candle body, indicating that buying interest started to effectively step in. Entering the second phase,on May 1 and May 4,consecutive bullish candles formed with slight volume expansion, as bulls gradually accumulated, marking the transitional phase before the formal start of the trend.Finally,In the third phase,Tesla rose from $386 to $398 (+3.1%) on May 6, from $407 to $411 (+1.0%) on May 7, and from $416 to $428 (+2.9%) on May 8.Three consecutive bullish candles formed with closing prices hitting new highs sequentially. The opening positions were all within the previous day’s real body range, showing almost no pullback, forming the 'Three White Soldiers' pattern — a steady upward push with a regular rhythm. The large bullish candle on May 11 further confirmed this structure.
Key Technical Indicators Interpretation
Moving Average (MA):The price is about $53.6 above the MA20 and approximately $61 above the MA50. The spacing between the moving averages is widening, indicating a complete structure. However, the price deviation from the moving average exceeds 13%. Historical data shows that at this level of deviation, the pressure for the price to converge toward the moving average accumulates over time, although the timing cannot be predicted.
RSI (74.061):It has entered the overbought zone (above 70). In a strong trend, the RSI can remain above 70 for an extended period. Being overbought does not necessarily mean an imminent decline, but one should watch whether the short-term upward momentum narrows. If the price makes a new high while the RSI moves lower, it would signal clear trend exhaustion.
MACD (11.272):Signal line at 4.522, golden cross formed with the gap continuously widening. The momentum histogram remains positive and is expanding, showing a complete trend momentum structure without any divergence.
Bollinger Bands:The price of $445 has exceeded the upper band at $428.72, with the channel in a significant expansion phase.
Technical Comprehensive Analysis
Tesla is the stock with the most complete trend structure among the three: bullish moving average alignment + MACD golden cross + Three White Soldiers pattern + confirmation by large bullish candlestick continuation, with all four signals pointing in the same direction. However, short-term risk signals are also the most concentrated among the three: RSI overbought + price surpassing the upper Bollinger Band + moving average deviation exceeding 13%, with all three occurring simultaneously.The key observation point in the near term is $428.72 – the position of the upper Bollinger Band and also the confirmation level for this breakout. If the price pulls back and finds support near this level while closing above it, the uptrend may continue. If it breaks below and closes below on a daily chart, attention should be paid to the possibility of the price moving towards the MA20 ($391.39) area.
Intel (INTC)

Intel recently experienced an extremely rare surge in price. Over the past 10 days, its share price surged from $84.52 to a high of $132.75, with a cumulative short-term gain of over 50%. However, the degree of overbought conditions on the technical side has reached extreme levels.
Intel's recent upward movement was dominated by several large bullish candlesticks,with May 8 being the most representative. The opening price was $111.81, reaching a high of $130.57 during the session, and closing at $124.92. The body of this candlestick is about $13.11, but it comes with an upper shadow of approximately $5.65 (from the high of $130.57 to the close of $124.92). The presence of the upper shadow indicates that the price once surged above $130 but failed to hold as buying pressure eased by the close, showing a slight pullback. This is the first sign of mild selling pressure at higher levels.
On May 11, the price opened with a gap up to $130.88, hitting a high of $132.75 during the session, but closed at only $129.44, forming a small bearish candlestick with a body of just $1.44, but with relatively long upper and lower shadows (upper shadow approximately $3.31, lower shadow approximately $6.96). This type of candlestick pattern is referred to as a 'High-Position Spinning Top' –Bulls pushed prices higher while bears drove them lower, ultimately closing near the opening level. Both sides fiercely battled at higher levels, but bulls failed to gain dominance.The appearance of this pattern serves as a warning signal for weakening trend momentum.
Another structure worth noting is: the high on May 8 was $130.57, and the high on May 11 reached $132.75. The two highs were close, but neither day managed to close effectively above $130 (closing at $124.92 and $129.44, respectively).The failure to hold onto gains during these two attempts carries technical significance as a 'nascent double top' pattern. While it does not yet constitute a strict double top (which requires further confirmation such as a neckline breakdown), the resistance at the two-day highs is worth monitoring.
Key Technical Indicators Interpretation
Moving Average (MA):The price deviates from the MA20 by 47.8% and from the MA50 by 103%. Based on historical statistical patterns, this degree of deviation is considered an extreme condition for most assets and warrants caution.
Relative Strength Index (RSI) (86.109):This represents an extremely rare and deeply overbought extreme value. If the stock price makes new highs in the coming days but this value declines instead, it would trigger a dangerous 'top divergence' warning.
Moving Average Convergence Divergence (MACD) (16.94):The signal line is at 13.13, with a golden cross confirmed. Both lines are above the zero axis, and the momentum histogram is positive and currently still expanding. However, the absolute value of MACD has reached a historical high, so it's crucial to closely monitor whether the momentum histogram begins to contract—once the histogram shifts from expansion to narrowing, it usually serves as an early warning sign of decelerating trend momentum.
Bollinger Bands:Among the three targets, this is the widest, reflecting Intel's extremely high recent price volatility. The price at $129.44 slightly exceeds the upper band at $129.35; in a strong trend, this is normal but also indicates heightened volatility and amplified risk.
Technical Comprehensive Analysis
Intel's mid-term trend structure remains intact (bullish moving average alignment, MACD golden cross), but short-term overbought risks are at their most extreme (RSI 86.109, 103% deviation from MA50, high-level spinning top bearish candle).
Two sets of signals form direct oppositions, and position control should be more cautious.Focus on two key nodes:
1. Whether the previous high of $132.75 on May 11 can be effectively broken through—If the price breaks through with volume and closes stably above $132.75, the logic for continued acceleration holds; if resistance occurs again here, combined with the high on May 8, vigilance is required for the potential formation of a double-top structure.
2. Stability of the support at $123.92—If the daily close breaks below this level, attention should be paid to the platform area between $113 and $108.15 to observe whether support can be found and stability regained.
Risk Disclaimer: The above content only represents the author's view. It does not represent any position or investment advice of Futu. Futu makes no representation or warranty.Read more


Comment (1)
to post a comment
41
37