April Recap of the Crypto Market: Dramatic V-shaped Rebound in US Stocks, BTC Sees Supply Contraction-driven Rally Amid Macro Headwinds | Bitcoin | Research Report | Cryptocurrency Market Analysis
In April 2026, $Bitcoin (BTC.CC)$ The market is showing structural divergence: the macro environment has not entered a typical easing cycle, with actual interest rates rising, oil price shocks, and persistent inflation still posing constraints; however, the risk asset market has not shifted to Risk-off. Instead, driven by the temporary easing of the US-Iran conflict, significantly better-than-expected corporate earnings, and a rapid rebound in US stocks, it has shifted back to Risk-on. Bitcoin’s price and on-chain structure have also recovered in sync, with prices rising from $68,228 to $76,313, a monthly increase of 11.8%.
The main logic behind Bitcoin's movement in April cannot be simply attributed to 'an independent rise amid strong macro headwinds,' nor can it be explained as 'the start of a new bull market under comprehensive global liquidity easing.' A more accurate description is: $Bitcoin (BTC.CC)$ In an environment where interest rate and inflation constraints remain but risk appetite temporarily rebounds, the force behind the oversold rebound first came from the rapid recovery of risk appetite in US stocks, which spilled over through channels such as DATs and ETFs, $Bitcoin (BTC.CC)$ and secondly from the significant decline in market selling pressure after consecutive declines, with the scale of transfers to exchanges by both long and short positions continuing to decrease, and exchange balances continuing to fall.
The core judgment of the April report is: April $Bitcoin (BTC.CC)$ It is closer to a 'supply contraction-driven oversold rebound' rather than a mid-cycle bull market expansion that has been fully confirmed. The external environment does not constitute a complete tailwind; internal structures have indeed improved, but the cyclical bear market liquidation is not yet complete. Single-cycle long-term holders still have a large number of floating loss positions, and realized losses from long-term holders transferring into exchanges in April were significantly higher than profits, indicating that some coin holders who entered at high levels and converted to long-term holders are still using the rebound to cut losses. Whether the market can upgrade from a temporary rebound to a higher-confidence cyclical reversal depends on whether capital inflows continue, whether single-cycle long-term holder liquidation continues to slow down, and whether internal sector vulnerabilities can avoid concentrated exposure.
Macro Finance: Interest rate and inflation constraints remain, but risk appetite has significantly rebounded
The macro-financial environment in April was not a one-directional full Risk-off but rather a complex combination of 'ongoing interest rate and inflation constraints, no strong suppression from the dollar, and a sharp recovery in US stock risk appetite.' The US 10Y yield rose from 2.15% to 2.42%, up 27 basis points in a single month; Fed Net Liquidity declined by about $120 billion, indicating that real interest rates and dollar liquidity still constrain long-duration risk assets. $Bitcoin (BTC.CC)$ In this context, the 10-year TIPS remains one of the most important macro variables this month. Bitcoin (BTC), which has no cash flow or coupon, sees its long-term valuation highly dependent on the opportunity cost of holding non-yielding assets. When real interest rates rose from 2.15% to 2.42%, the real yield for investors holding U.S. Treasuries increased, and the relative attractiveness of holding BTC declined. Therefore, the rise in real interest rates still suppresses BTC's valuation.
The U.S. Dollar Index (DXY) closed at approximately 98.06 on April 30, with an average of about 98.48 in April, representing a monthly change of approximately -1.89%. This means that in April, $Bitcoin (BTC.CC)$ the macro pressures faced mainly stemmed from real interest rates, oil prices, and inflation expectations, while a weaker dollar provided some support for risk assets. This helps explain why Bitcoin (BTC) was still able to rebound despite high real interest rates and geopolitical oil price shocks.
The stickiness of inflation further tightened policy constraints. The Cleveland Fed’s instant forecast for April CPI was around 3.71% YoY, significantly higher than levels seen in March; the BEA’s release on April 30 of the March PCE price index showed a year-over-year increase of 3.5%, also indicating that inflationary pressures had not disappeared. On the labor market front, April’s non-farm payrolls increased by +115k, with unemployment remaining steady at 4.3%. This set of data indicates that the labor market is cooling but has not yet entered a state of stalling. A cooling job market helps limit narratives of further rate hikes but is insufficient to support a rapid restart of easing trades. The Fed remains closer to a 'data-dependent hawkish pause' rather than the start of an easing cycle.
The escalation of tensions in the Strait of Hormuz and rising oil prices are significant variables that must be factored into the macro chain for April. Affected by shipping disruptions in the Strait of Hormuz and Middle East conflicts, Brent crude saw a significant spike in April and remained at elevated levels. On the surface, geopolitical risks might easily be interpreted as a safe-haven narrative for Bitcoin (BTC), but from the perspective of the actual transmission mechanism, this month’s geopolitical risks acted more as a negative constraint on BTC. The transmission chain is as follows: Rising risks in the Strait of Hormuz lead to higher crude oil prices, increasing energy and transportation costs, making inflation expectations sticky again, making it harder for the Fed to quickly pivot to easing, keeping real interest rates high, and ultimately compressing the valuation of risk assets. In the current global capital pricing system, BTC is still largely viewed as a high-Beta risk asset rather than a traditional safe-haven asset.
However, the most important positive variable in April was that U.S. equity risk appetite did not retreat but instead recovered rapidly. The S&P 500 rose 10.4% in April, while the Nasdaq surged approximately 15.3%. The strong rebound in U.S. equities came partly from the nearing end of the Israel-Iran conflict, with markets pricing in advance that the worst inflation shock had passed, and partly from the S&P 500 constituent companies significantly beating earnings expectations. Data from FactSet and Nasdaq both show that in late April, Q1 earnings season was notably stronger than expected, with about 84% of reported companies surpassing EPS forecasts and about 81% exceeding revenue expectations. The blended EPS growth for the S&P 500 once reached approximately 27.1%. Strong earnings led investors to temporarily overlook high oil prices, high valuations, and AI capital expenditure pressures, while readjusting their allocations toward riskier assets.
Thus, we conclude the following regarding the macro-financial layer in April: Bitcoin (BTC) is not operating under purely strong external headwinds, but rather in a mixed environment where “real interest rates and inflation constraints remain, the dollar hasn't formed strong pressure, and U.S. equity risk appetite has significantly improved.” Rising real interest rates have increased the opportunity cost of holding BTC, and risks from the Strait of Hormuz have reinforced inflationary pressures via oil prices, delaying expectations of Fed easing. However, the U.S. dollar index did not strengthen, and U.S. stocks did not pull back; instead, they sharply rebounded due to strong earnings and easing war risks. Therefore, the April BTC rally cannot be explained by broad macro easing, nor can it be described as completely countering macro trends. A more accurate explanation is that BTC benefited from improving U.S. equity risk appetite and inflows through DAT/ETF channels, allowing it to rise despite ongoing policy and inflation constraints.
Market Structure: Abundant buying power from DAT companies and Bitcoin ETFs, though sustainability still needs to be verified.
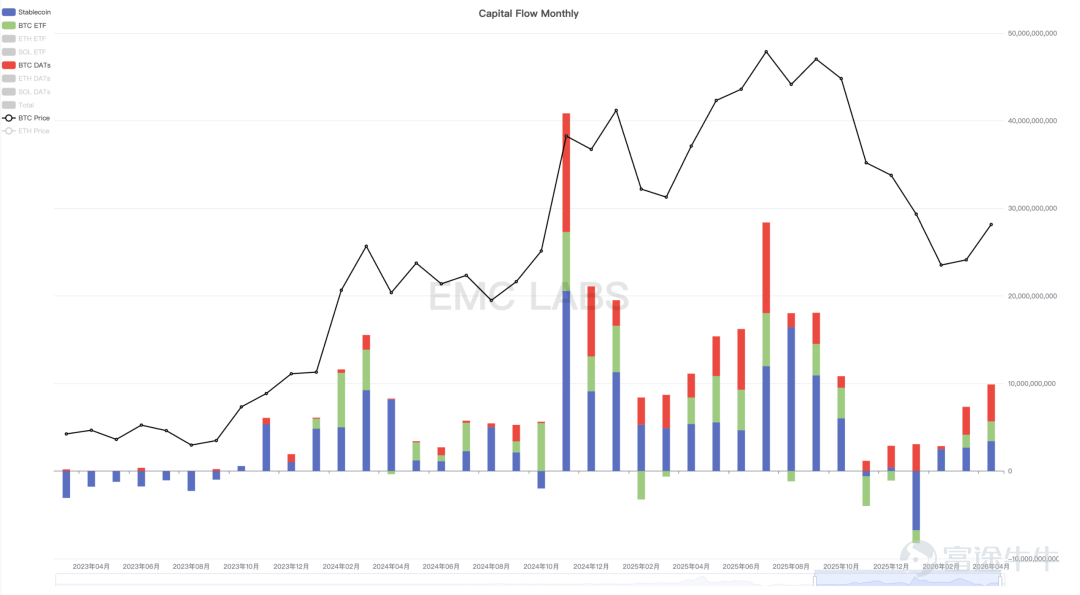
If we only look at prices, in April $Bitcoin (BTC.CC)$ Bitcoin (BTC) seemed to enter a strong upward phase. However, from the perspective of fund flow structure, this month looked more like a stage of buying power being driven through DAT, ETF channels after external risk appetite improved, combined with reduced selling pressure, jointly driving the rebound rather than a comprehensive liquidity expansion within the crypto space. According to statistics from eMerge OS, an AI data platform under EMC Labs, over $9.8 billion flowed into the Bitcoin market in April, marking two consecutive months of significant inflows since February, showing sufficient market absorption capacity at current price levels. This data suggests that the April rally was not entirely lacking demand-side support, but the composition of fund sources dictates it should still be cautiously interpreted.

BTC Market Capital Monthly Inflow and Outflow Statistics
Among the three types of capital channels, DAT companies represented by Strategy have been the most aggressive, purchasing approximately $3.184 billion and $4.217 billion worth of BTC in March and April, respectively. On one hand, this provided significant marginal buying pressure for the market; on the other hand, DAT companies bought BTC using U.S. equity financing, sending bullish signals to the market, thereby supporting long-side confidence. The characteristics of this type of capital include strong buying power, fast narrative propagation, and a pronounced impact on price elasticity, but its constraints are also clear: DAT buying power is highly dependent on U.S. equity financing conditions, secondary market valuations, and investor risk appetite. Once U.S. stock risk appetite declines or the financing capacity and capital market narratives of DAT companies weaken, their buying power may quickly decrease.
The BTC ETF channel has also provided phased support, but from a behavioral perspective, it leans more towards being impulsive rather than steadily expanding. Although ETF inflows did not completely stall in April, they were neither continuous, unilateral, nor consistent with cyclical allocation flows. The significance of ETFs to BTC lies in directly introducing traditional financial market risk appetite into BTC pricing mechanisms, but this also means that BTC becomes more tied to U.S. equities and dollar asset risk budgets. When U.S. stocks rebound due to better-than-expected earnings and easing war risks, the ETF channel can amplify BTC buying power; however, if U.S. stock risk appetite weakens again, ETFs could become conduits for capital outflows.
Capital through stablecoin channels also synchronized with BTC ETF purchases, but was slightly less stable.
This structure explains why the quality of the April rally wasn't bad, but its sustainability still needs verification. The quality was acceptable because the rise wasn’t driven by high leverage; funding rates didn’t overheat, exchange balances continued to decline, and short-term panic selling temporarily eased. Sustainability needs validation because buying power heavily relies on U.S. stock risk appetite, DAT financing environments, and ETF absorption capacity, while there’s still single-cycle long-position liquidation pressure on-chain. If DAT/ETF/stablecoins continuously show net inflows, total capital flow keeps expanding, and long-hand loss selling continues to decline, then the current rebound might upgrade to a higher-confidence cyclical reversal. Conversely, if DAT buying power decreases, ETFs turn into sustained outflows, stablecoins weaken simultaneously, and loss-making long positions continue to exit on rebounds, the market will shift back to a fragile state dominated by liquidity gaps after being driven by seller exhaustion.
On-chain Structure: Declining Selling Pressure is the Core Foundation of the Rebound
Compared with the mixed state at the macro level, changes in BTC's on-chain structure in April were clearer: the market showed signs of selling fatigue after consecutive declines, with significantly reduced selling pressure and further contraction of circulating supply. On-chain data shows that weak hands' holdings continued to be absorbed, short-term loss pressures eased, long-term holders did not massively distribute, and sellable supply on exchanges decreased. The reason this rally succeeded was not due to unconstrained expansion of buying power, but rather because marginal selling pressure declined first.
According to eMerge OS data, in April, long and short hands collectively transferred 561,568.09 BTC to exchanges, significantly lower than the selling volumes in January and February, marking two consecutive months of decline. This change indicates that forced selling in the market is diminishing after consecutive sell-offs. Selling fatigue implies that some loss-making holders have completed stop-loss actions, while those still holding losses are showing increased acceptance of the current price range. It is on the basis of declining selling pressure that improved external risk appetite and on-site capital inflows are magnified into price rebounds.

Monthly Long and Short Hand Exchange Selling Statistics
Long-term holder supply continued to rise, further reinforcing the conclusion of supply contraction. LTH holdings increased from 14.64M BTC to 14.78M BTC, adding about 140,000 BTC. Long-term holders locking up their positions means further contraction of circulating supply and that the upward movement in price did not trigger meaningful overall long-term position liquidations.
The decline in exchange balances aligns with the aforementioned directional changes. The balance decreased from 3.04M Bitcoin to 3.00M Bitcoin, reducing by approximately 40,000 Bitcoin. Exchange balances essentially represent short-term sellable supply; a drop usually means more Bitcoin is being transferred to cold wallets, institutional custody, or long-term storage systems, lowering the probability of entering the market for sale in the short term. When long-term holder (LTH) positions rise, exchange balances decrease, and transfers of both long and short-term hands into exchanges decline simultaneously, it indicates that the market is transitioning from a high-liquidity selling state to a low-liquidity holding state. This structure significantly alters price elasticity: even without continuous expansion of new buying power, prices may still experience a strong rebound as long as marginal selling pressure decreases.
The structure of short-term holders has also shown clear recovery. Short-Term Holder (STH) Balance dropped from 2.31M Bitcoin to 2.23M Bitcoin, indicating a decrease in the proportion of short-term holders; the cost basis for STHs fell from $82,767 to $78,860, and their unrealized losses improved from -0.21 to -0.03, nearing breakeven. Short-term holders are typically the most sensitive group in the market and the ones most likely to create forced selling pressure. When STHs are in deep losses, further price declines can easily trigger panic selling; when STH holdings recover to near breakeven, forced selling notably diminishes.
However, the improvement in on-chain structures does not equate to the completion of cyclical capitulation. In April, realized losses from LTH groups transferring Bitcoin to exchanges were as high as $996 million, while realized profits were only $480 million, making the loss-to-profit ratio nearly 2:1. This data reveals significant internal fragmentation within long-term holdings: early long-term holders still have substantial profit cushions, but those who entered at the last peak and have held coins for over 155 days continue to use rebounds to cut losses. As of April 30, the long-term holder group still had 4,374,378 Bitcoin in a loss-making state, accounting for 29.43%. From a valuation perspective, an overall LTH unrealized profit of 1.59 means that, as a group, they still retain about a 59% profit cushion, but this is an extremely fragmented average: approximately 70% of early holders have unrealized gains, while about 30% of newer long-term holders are still under unrealized loss pressure. These 4.37 million loss-making BTC among long-term holders constitute the most tangible physical resistance zone in the future upward price trajectory.

Daily Loss Statistics for Long and Short Groups
The perpetual contract Funding Rate fell from 0.00002 to -0.00004, remaining neutral or negative multiple times in April, and even reaching -0.00012 during the mid-month price rally. If the rally was primarily driven by leveraged long positions, the funding rate would typically be significantly positive. The lower funding rate this month, even turning negative, suggests that the rally is more likely due to spot absorption, short covering, or passive adjustments of hedging positions, rather than one-sided leveraged buying.
Therefore, the core conclusion regarding the on-chain structure in April is: the reduction in selling pressure forms the basis for the rebound, but cyclical capitulation is not yet complete. On the positive side, panic selling from short-term holders has temporarily eased, exchange balances have decreased, long-term holders continue to lock up their positions, and derivatives leverage has not overheated; on the risk side, single-cycle long-term holders still hold large amounts of loss-making coins and are using rebounds to cut losses. The current market isn't rising because all pressures have disappeared, but because selling pressure has marginally declined, and capital risk appetite has undergone a phase of repair, temporarily improving the supply-demand relationship.
Outlook: Rebound Established, but Confirmation of Bottom Still Depends on Capital Sustainability and Long-Term Holder Liquidation Levels
Synthesizing macro-financial, market structure, and on-chain structural analysis, the essence of the current Bitcoin market movement is: a supply contraction-driven oversold rebound amid ongoing macro constraints and a phase of risk appetite recovery, with moderate confidence. It is not directly defined as a mid-bull-market expansion because although the price rebound in April was robust—MVRV rose from 1.25 to 1.41, NUPL increased from 0.35 to 0.37, long-term holders continued accumulating, exchange balances decreased, and funding rates did not overheat—the cyclical bear market capitulation is not yet complete. Approximately 4,374,378 Bitcoin held by long-term holders remain in a loss-making state, accounting for 29.43%; in April, realized losses from LTH transfers to exchanges were as high as $996 million, versus realized profits of only $480 million, showing that single-cycle long-term holders are still cutting losses during rebounds.

Percentage of Loss-Making Holdings Among Long-Term Holder Groups
This characterization better integrates macro, capital flow, and on-chain data across three layers. Macroscopically, real interest rate and inflation constraints persist, the Fed has not entered an easing cycle, but the US dollar hasn't formed strong suppression, and risk appetite in US equities has significantly recovered; whether inflows triggered by risk appetite can sustain remains questionable. In terms of on-chain data, selling pressure has decreased, short-term holders have recovered, long-term holders overall continue locking positions, but single-cycle long-term holders still possess substantial loss-making coins. Combining these three layers, the most reasonable main theme isn’t 'comprehensive bull market,' nor 'continued simple bear market downtrend,' but 'supply contraction-driven rebound following exhaustion of selling pressure.'
The most important confirmation condition going forward is 'continued capital inflows while long-term holder (LTH) loss selling continues to decline.' Specifically, DAT buying power must not weaken rapidly; Bitcoin ETF daily net inflows need to form continuity again, and stablecoin net flows must transition from marginal recovery to sustained positive inflows. Meanwhile, LTHs transferring realized losses to exchanges should continue to decline, and the proportion of loss-making holdings by long-term hands should gradually decrease. If these conditions occur simultaneously, the current rebound will no longer just be a recovery after consecutive declines but could evolve into a higher-confidence cyclical reversal.
The most critical failure condition, however, would be 'weakening capital inflows combined with continued stop-losses by single-cycle long-term holders.' If DAT firms' ability to finance Bitcoin purchases weakens, ETFs turn into continuous outflows, stablecoin channels weaken in tandem, and LTH loss-making positions continue to transfer to exchanges, then the main driver of April's rebound will dissipate. The market will shift from a recovery structure of 'declining selling pressure + enhanced external buying power' back to a fragile state where 'supply still needs to clear, and buying power cannot absorb it.' In this scenario, prices may not immediately enter a one-sided decline, but high volatility oscillations are more likely, and the bottom formation might complete through a sharper drop.
The macro environment also requires continuous monitoring. If the 10-Year TIPS yields fall, oil price pressures ease, real-time inflation forecasts decline, and U.S. stock earnings continue to support risk appetite, the external environment will shift from 'mixed and somewhat constrained' to 'marginally friendly,' allowing Bitcoin’s internal supply structure to gain better external support. Conversely, if oil prices remain elevated due to risks around the Strait of Hormuz, inflation expectations rise further, Federal Reserve easing expectations get pushed back, and U.S. stock earnings and valuations fail to sustain Risk-on sentiment, then DAT/ETF channel buying power could quickly diminish. Since Bitcoin’s April rally partially relied on spillover risk appetite from U.S. stocks, the sustainability of that risk appetite itself becomes one of the variables for Bitcoin’s future validation.
Thus, the final conclusion for Bitcoin’s market in April is: The rise itself isn't the most crucial information; what truly matters is that Bitcoin completed a phase of rebound amid ongoing real interest rate and inflation constraints, relying on declining selling pressure, recovering risk appetite, and capital inflows via DAT/ETF channels. This suggests that Bitcoin’s scarcity is becoming an increasingly vital pricing factor, though the dependency on funding sources tied to U.S. stock risk appetite and DAT financing environments cannot be ignored. Bitcoin remains a high-beta risk asset, but its internal structure is showing stronger characteristics of long-term holding, low circulating supply, and spot absorption. In the future, if capital inflows continue to confirm and long-term holders’ liquidation declines, the market may upgrade from an oversold rebound to a cyclical reversal. However, if capital inflows weaken and single-cycle long-term hands use the rebound to cut losses, the market will re-enter a fragile phase dominated by liquidity gaps. For position management, core positions can be maintained, satellite positions should wait for confirmation of sustained capital inflows, and leverage should be used cautiously. The current market is neither a completely trendless phase nor a risk-free acceleration phase where macro and chain-clearing constraints can be ignored.
The above analysis is provided by EMC Labs.
———————————————————————
About EMC Labs
EMC Labs is a partner of Victory Securities, and together they have launched the only virtual asset fund approved by the SEC to accept stablecoin subscriptions—the Victory EMC BTC Cycle Fund. EMC Labs was co-founded by seasoned virtual asset investors and data scientists, with a core team hailing from JD.com Finance, Bell Labs, Marsbit, and other companies. EMC Labs has invested substantial resources in building a professional engine to analyze Bitcoin’s on-chain data and technical indicators.
Disclaimer
Investment involves risks, and investors should take note. The value of securities and investments can go up as well as down and is not guaranteed. Investors may not get back the original investment amount, and past performance is not necessarily indicative of future results. Victory Securities’ securities trading services are provided by Victory Securities Limited (hereinafter referred to as “Victory Securities”). This document was prepared and authorized for release on this platform by Victory Securities Limited, and the information contained herein is for reference purposes only. Victory Securities Limited reserves the right to make changes or terminate at any time without prior notice. All information provided on this platform, including this document and its contents, may not be reproduced, linked, reposted, or otherwise copied for publication or commercial use by any media, website, or individual without prior written authorization from Victory Securities. Authorized users must acknowledge that the source material originates from Victory Securities when using this document and its content, and commit to complying with relevant laws and all international conventions regarding internet usage, refraining from illegal purposes or unlawful use of this document. Violators will bear all associated legal and financial responsibilities. Data or figures quoted in this document may come from third parties; Victory Securities does not guarantee the accuracy of such third-party data or materials, nor will it assume liability for the fairness, accuracy, timeliness, completeness, or correctness of any data, forecasts, and/or opinions contained herein, nor the benchmarks upon which such forecasts and/or opinions are based. Any forward-looking statements in this document do not constitute guarantees of future performance, and actual circumstances or developments may differ significantly. This document is not and should not be considered or construed as an offer, invitation, solicitation, recommendation, advice to buy or sell any investment products, or as a basis for investment decisions, nor should it be interpreted as professional advice. Readers or those making investment decisions should fully understand the risks involved and the legal, tax, and accounting characteristics and consequences, and decide whether investing aligns with personal objectives and risk tolerance. Seek appropriate professional advice if necessary. In certain countries, the distribution and circulation of this document may be restricted by law or regulation, and recipients should be aware of and comply with such restrictions.
Risk Disclaimer: The above content only represents the author's view. It does not represent any position or investment advice of Futu. Futu makes no representation or warranty.Read more

Comments
to post a comment
2