The Hang Seng Index is approaching the 26,400 level, entering a consolidation phase before a potential breakout.
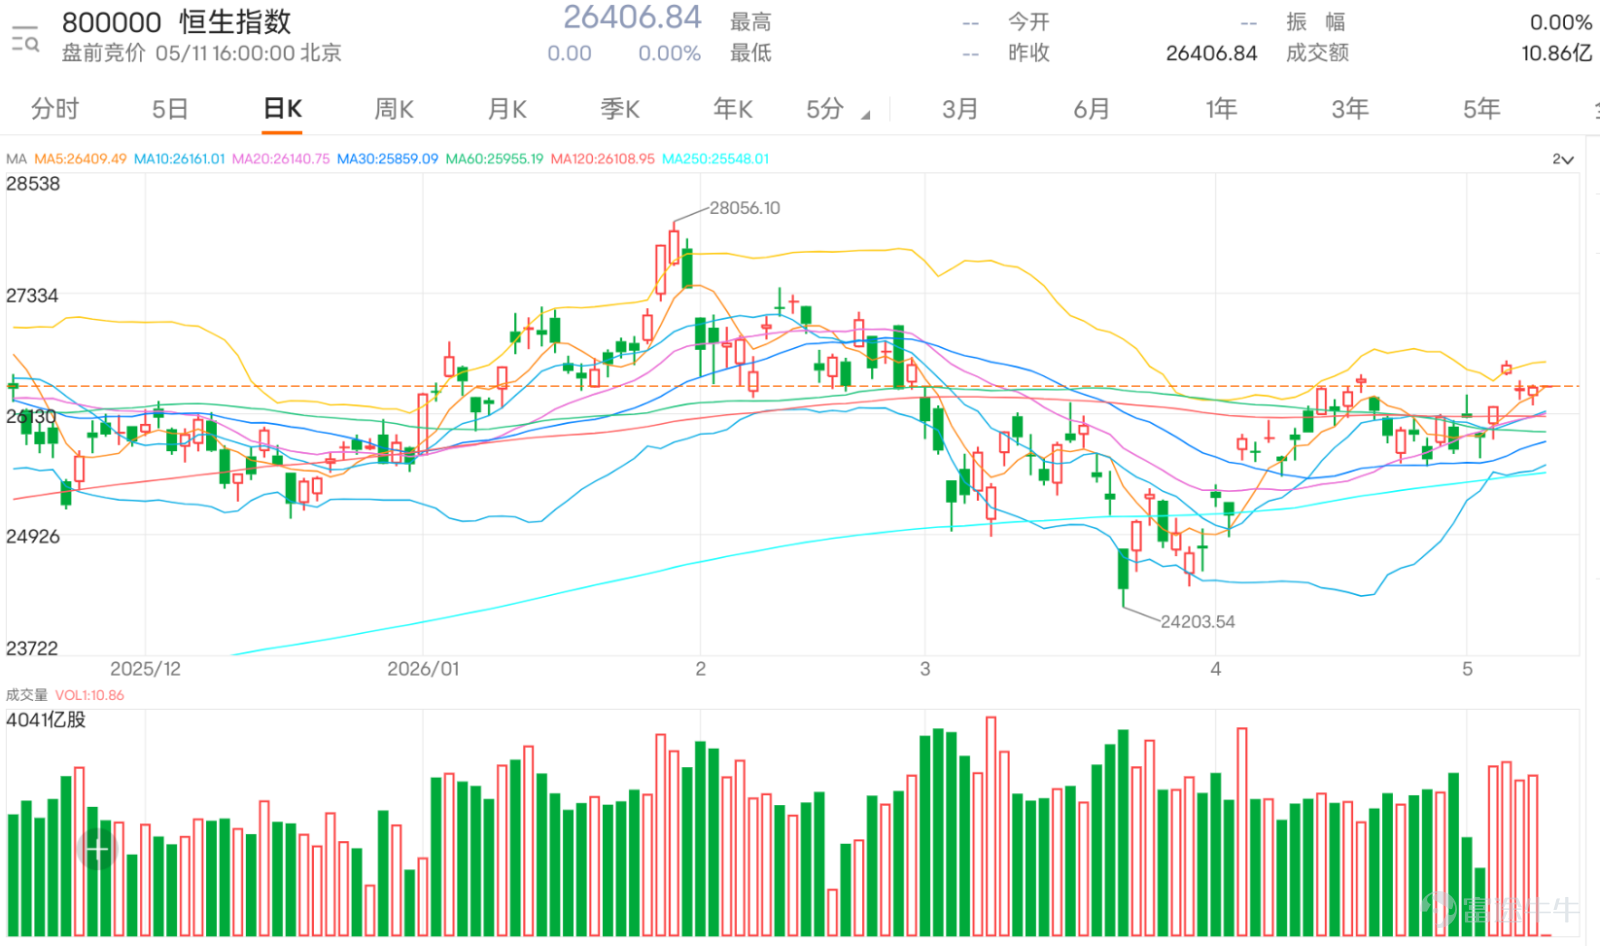
$Hang Seng Index (800000.HK)$ Last session closed at 26,406. The overall structure has shifted from a rebound from the lows to consolidation at higher levels, and it is now close to the upper boundary of the recent sideways range. From the chart, the index has moved back above the 10-day line at around 26,112 and the 20-day line at approximately 26,103, while also remaining above the 30-day line at about 25,823, indicating a short-term bullish bias. However, the issue is that the current price is nearing the upper Bollinger Band at around 26,642, which means the index has entered a resistance zone rather than being at the start of an upward trend.
From a technical perspective, 26,100 is currently the most important support level because it corresponds to both the 20-day line and the Bollinger Bands' midline. A break below this level would destabilize the short-term rebound structure, with the next support level seen near 25,820, corresponding to the 30-day line region. Conversely, resistance lies in the 26,450 to 26,640 range. Notably, 26,450 has already been mentioned in investor comments, reflecting its recognition as a short-term critical level, while 26,640 represents pressure from the upper Bollinger Band. In other words, the Hang Seng Index is not in the midst of an uptrend but is 'stuck below the resistance zone.'
The RSI is around 59, showing a neutral-to-strong bias but not yet in the overheated zone. This suggests there is still room for upside, but it also indicates that momentum hasn't fully erupted. This situation typically reflects one scenario: the market intends to move higher but needs a catalyst to break through.
Investor sentiment is clearly polarized. Bullish comments are extremely direct, such as 'Go up, up, up!' or 'Bullish, bullish, bullish...' These types of sentiments usually emerge during the later stages of a rebound, signaling that the market is starting to form a consensus expectation. Such expressions are not analysis but emotional resonance. When such voices flood the market, a successful breakout above resistance can indeed trigger accelerated buying.
But at the same time, bearish comments were also quite aggressive, such as 'sell quickly', 'turning bullish into bearish', 'big drop tomorrow'. This indicates that another group of funds has started to defend at higher levels, or even prepare to reverse their positions. This situation is very typical in key resistance areas, as both bulls and bears know this is where the direction will be decided.
More noteworthy are the观望 (wait-and-see) comments. The market has started to see voices like 'both bulls and bears should stay out', 'will it pull back', and 'can returns be sustained'. This represents that most capital actually lacks a clear direction and is waiting for confirmation. When the market enters this state, prices often show false moves first, such as short-term breakouts or sharp drops, before deciding the true direction.
The mention of '26400 slightly' in the comments is also very critical, as this is exactly where the current price is located. The market has realized that the index is at a tipping point, not a safe zone. Other comments like 'sharp drop at 3 PM' and 'drop only after 3:30 PM' reflect that short-term funds have started to anticipate intraday volatility, indicating that intraday traders are also highly sensitive at this level.
Structurally, the Hang Seng Index is currently in a typical 'sandwich zone' with resistance above and support below. Before breaking through 26450 to 26640, it should not be considered as entering a new uptrend; but at the same time, as long as 26100 is not breached, it cannot be simply judged as weakening. The real direction will only be triggered at these two levels.
For short-term strategies, 26450 is the first breakout level. Only when it breaks through and stabilizes can it extend towards 26640 or even higher; 26100 is the defensive level, and if it falls below, a retest of 25820 or even deeper correction needs to be prevented. Around the current price of 26400, it's an asymmetric risk-reward zone with potential for movement in both directions, thus the betting value is neutral to cautiously optimistic.
In summary, the Hang Seng Index isn't about going up or down now, but rather 'preparing to move'. Breaking above 26450 confirms the trend, falling below 26100 signals the end of a rebound, and the market is waiting for this decisive moment.


Replying to some investors' comments
@公牛紅牛乳牛神牛: It is indeed on the stronger side right now, but before breaking through 26450, it still can't be considered as entering an accelerated uptrend.
@Onlai7: 26450 is a clear resistance level. If touched but fails to stabilize, the likelihood of a pullback will increase.
@安YUJIN: Immediate drops usually occur when pressure is felt in resistance zones, but the key remains whether 26450 can be broken through.
@喜相迎The direction for tomorrow depends on today's closing position; if it holds above 26,400, an immediate downturn may not occur.
@李硕A major reversal would require a break below 26,100, but this signal has not yet appeared.
Feel free to share your insights in the comment section. For more market analysis, please continue following ‘Hong Kong Stock Warrants Jenny’ for daily updates!
Reminder: This article does not constitute any investment advice.
This article is for reference only and does not constitute any investment advice. Market data, opinions, and analysis contained herein may change at any time without prior notice. We are not responsible for any loss or damage caused by reliance on the information in this article. Technical analysis only shows whether certain technical conditions are met; asset performance should be comprehensively evaluated using other sources of information, and trading decisions should not be made solely based on this article. Please note that past performance is not indicative of future results.
#HongKongStocks #RealTimeAnalysis #WarrantSelection #WarrantGuide #DerivativesHedging #HongKongWarrantsJenny #HangSengIndex #HangSengTechIndex #BlueChipStocks #TechnicalAnalysis
Risk Disclaimer: The above content only represents the author's view. It does not represent any position or investment advice of Futu. Futu makes no representation or warranty.Read more

Comments (2)
to post a comment
1