Kuaishou retraces but holds above the 10-day line, rebound structure remains intact
Kuaishou's stock price closed at HKD 51.8, down 2.17%, with an intraday low of HKD 50.20. Total daily turnover reached HKD 5.486 billion, with a trading range of approximately 5.4%. Last week, Kuaishou experienced a sharp rally — gaining about 20% cumulatively between May 5 and May 8. On May 8, it even briefly touched HKD 53.7, surpassing the 50-day moving average (around HKD 51.6). Southbound capital recorded a single-day net inflow of HKD 1.747 billion, reaching a recent high. However, Monday saw a rapid pullback and the stock closed near its intraday low, reflecting profit-taking adjustments after the recent gains.
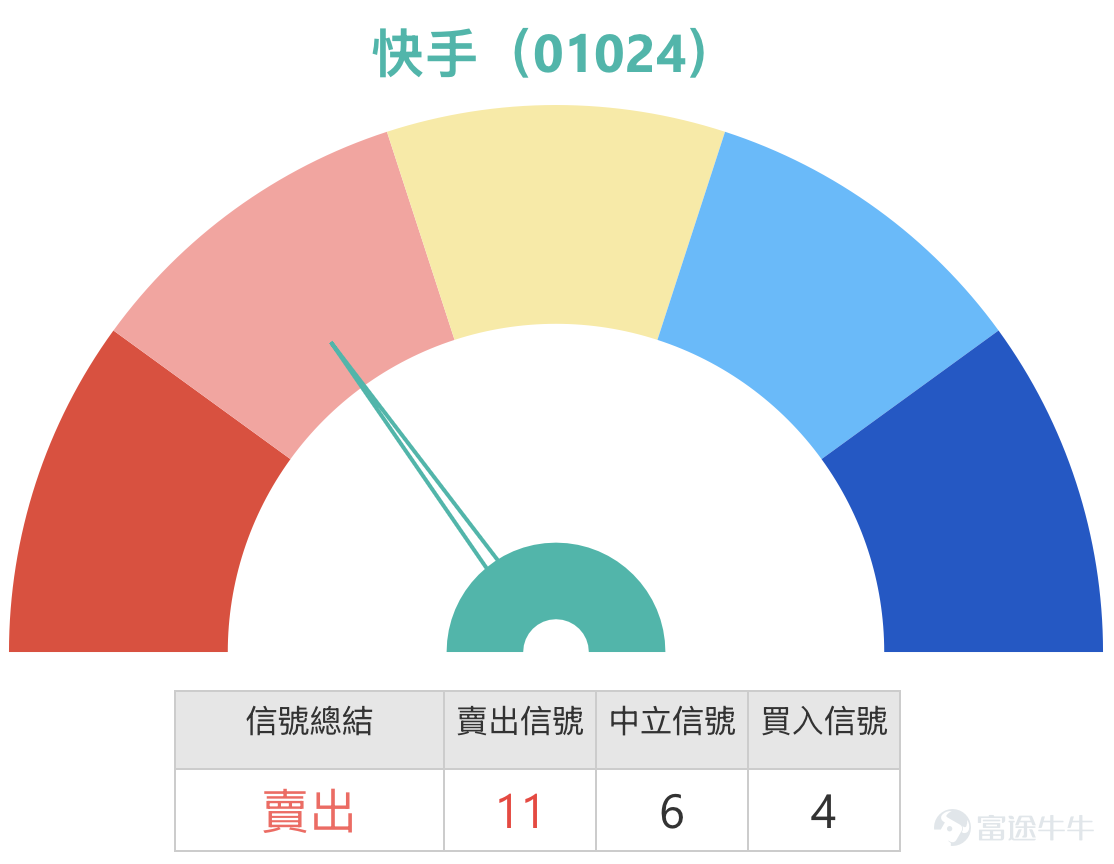
Technical analysis
The stock price is currently in a convergence zone of multiple moving averages: the current price of HKD 51.75 is slightly above the 10-day line at HKD 45.91 and the 30-day line at HKD 45.89, with the 60-day line at HKD 54.26 just within reach. The overall technical indicator signal suggests a 'sell'. Multiple oscillation indicators show mixed signals (Williams %R, Stochastic Oscillator, and CCI all suggest selling), while ADX and MACD maintain a 'buy' signal, indicating a battle between bullish and bearish forces following the sharp rise. RSI stands at 62, retreating from last week’s overheated levels, placing it in a neutral-to-strong position. Momentum has contracted but there is no confirmation of a weakening trend. Bollinger Bands remain in a 'buy' position. The bull-bear power indicator suggests a sell. A summary score of 11 for technical indicators indicates increasing short-term pullback pressure, but the rebound structure formed last week remains intact.
Support and Resistance
First support is set at HKD 47.3 (near the consolidation platform's high post-breakout last week), second support at HKD 44.5 (near the April low region). For reference, the lower Bollinger Band is around HKD 44.3, creating a dual-support area. First resistance above is at HKD 55.0 (the 60-day line and recent high form a dual-pressure zone), with second resistance at HKD 59.0. The probability of an upward move is 51%, showing a neutral-to-strong stance. Whether the stock can stabilize above HKD 47.3 will be a key point to watch for the continuation of the short-term rebound; otherwise, if it breaks below, attention should turn to the support level between HKD 44.5 and the lower band.

Market news updates
The recent stock price movement of Kuaishou has mainly revolved around catalysts in the AI sector. On May 8, Ke Ling AI launched the industry's first native 4K direct output feature in its Video 3.0 model, supporting one-click generation of cinema-grade videos, with professional delivery capabilities recognized by advertising and film clients, becoming an important breakthrough for technical differentiation among short video peers. On the same day, CEO Cheng Yixiao clearly stated in the earnings call that Ke Ling AI revenue is expected to double by 2026, with plans to add 11 billion yuan in AI capital expenditures. On May 11, Haitong International issued a report stating that market discussions on the potential spin-off of Ke Ling from Kuaishou are heating up. The spin-off is expected to expand financing channels for Ke Ling, alleviate Kuaishou's AI capital expenditure pressure, and help restore valuation for its traditional core business; the firm believes that if Ke Ling officially spins off and goes public, Kuaishou's comprehensive valuation could reach HKD 84.
In terms of major institutions, Oriental Securities maintained a 'Buy' rating on the same day, with a target price of 74.06 yuan, favoring Ke Ling’s leading advantages in technology and commercialization. Citi gave a 'Buy' rating with a target price of 72 HKD, believing that the potential of the Ke Ling model is sufficient to offset the impact of slowing e-commerce GMV growth. Daiwa Jikin set a target price of 82 HKD, pointing out that investor sentiment is gradually improving. Fundamentally, Ke Ling AI's annual revenue last year exceeded 1 billion yuan, and this January alone ARR surpassed 300 million USD, showing a clear trend of accelerated commercialization. The market is focused on further data confirmation of GMV and Ke Ling revenue in Q1 2026 results, which will be announced at the end of May.
Comprehensive judgment
The key short-term factor is whether 47.3 yuan can hold steady. If it holds, Kuaishou may gradually recover towards the resistance zone near 55 yuan, waiting for clearer catalysts such as earnings or spin-off news. If investors already hold positions, they should first observe the defensive strength at 47.3 yuan; if not yet entered, it's advisable to patiently wait for a pullback to confirm support near 47.3 yuan before considering deployment. Due to RSI falling and technical indicators showing divergence, chasing highs has a low reward-to-risk ratio. A prudent approach is to wait for signs of a bottom before making moves.
Warrant Product Review
Reviewing the warrant products mentioned on May 7, the performance within two trading days after the mention (up to May 9) is as follows. HSBC call warrants (27738) gained 31%, while the underlying stock rose 6.92% during the same period, with high leverage significantly amplifying the rebound. Morgan bull certificates (69508) surged 37%, performing even more prominently, showing the highest elasticity among similar products during the period. Another Morgan bull certificate (68122) rose 30%, also significantly outperforming the underlying stock. UBS Group call warrants (27777) gained 27%, also outperforming the underlying stock during the same period.

Warrant product recommendations
The following products are analyzed based on today’s Kuaishou share price of 51.75 yuan and are associated with the above-mentioned support and resistance levels.
For bullish directions, if investors expect Kuaishou to hold steady at 47.3 yuan and break through the resistance at 55.0 yuan, they can consider two call warrants. Morgan call warrants (27499), with a strike price of 58.9 yuan, effective leverage of 4.4 times, lowest premium and implied volatility in the same category. Low implied volatility means the product price follows changes in the underlying stock more directly, being less affected by market sentiment fluctuations. The strike price of 58.9 yuan is very close to the second resistance level at 59.0 yuan, suitable for expecting the stock price to test 59.0 yuan after breaking through 55.0 yuan. UBS Group call warrants (27777), with a strike price of 58.05 yuan, effective leverage of 3.4 times, relatively lower premium, slightly lower exercise price than Morgan's product, reacting faster after confirming the breakout, suitable for investors with active short-term trading styles.
If expecting Kuaishou to face resistance near 55.0 yuan and retreat, or fail to hold the support at 47.3 yuan, put warrant strategies can be considered. CSC Financial put warrants (17395), with a strike price of 49.88 yuan, effective leverage of 2.8 times, lowest premium and implied volatility in the same category, strike price below the first support level at 47.3 yuan, suitable for deeper retracement deployments expecting a drop to 44.5 yuan after failing to hold support. Bank of China put warrants (17484), with a strike price of 49.93 yuan, effective leverage of 2.5 times, highest leverage and lower premium in the same category, more sensitive to stock price declines, suitable for short-term follow-ups after confirming weakening trends.

For bullish views, consider Morgan bull certificates (69508) $JP#KUASORC2610F.C (69508.HK)$ With a recovery price of 41.5 yuan, effective leverage of 4.0 times, and the highest actual leverage with the lowest premium in its category, there is a 3-yuan buffer before the second support level at 44.5 yuan. This provides a larger safety margin for rebound strategies, making it suitable for those expecting the price to hold steady at 47.3 yuan and gradually rebound. For bearish strategies, UBS Group’s bear certificate (62026) can be selected. $UB#KUASORP2812H.P (62026.HK)$ With a recovery price of 60 yuan, effective leverage of 5.2 times, the lowest premium, and relatively high actual leverage, the recovery price is above the second resistance zone. This makes it suitable for strategies anticipating that the resistance zone between 55.0 yuan and 59.0 yuan will effectively suppress stock prices. HSBC's bear certificate (64295), with a recovery price of 60 yuan, effective leverage of 5.1 times, the highest actual leverage in its category, and lower premiums, offers similar terms and serves as an alternative deployment option for the same perspective.
Feel free to leave a comment and share your thoughts! Follow Jenny's HKEX Warrants for more professional analysis.
Warm Reminder: This article does not constitute any investment advice. It is for reference only and does not constitute any investment advice. The market data, opinions, and analysis contained herein may change at any time without prior notice. We are not responsible for any loss or damage caused by reliance on the information in this article. Technical analysis only shows whether certain technical conditions are met; a comprehensive evaluation of asset performance should be made using other data, and trading decisions should not be based solely on this article. Please note that past performance is not indicative of future results. Follow HK Stocks Warrants Jenny for more professional insights.
Risk Disclaimer: The above content only represents the author's view. It does not represent any position or investment advice of Futu. Futu makes no representation or warranty.Read more

Comments
to post a comment
3