Xiaomi Group's Short-term Battle: Key Support Holds Steady, Can an Uptrend Restart Amid Oscillation Indicator Divergence?
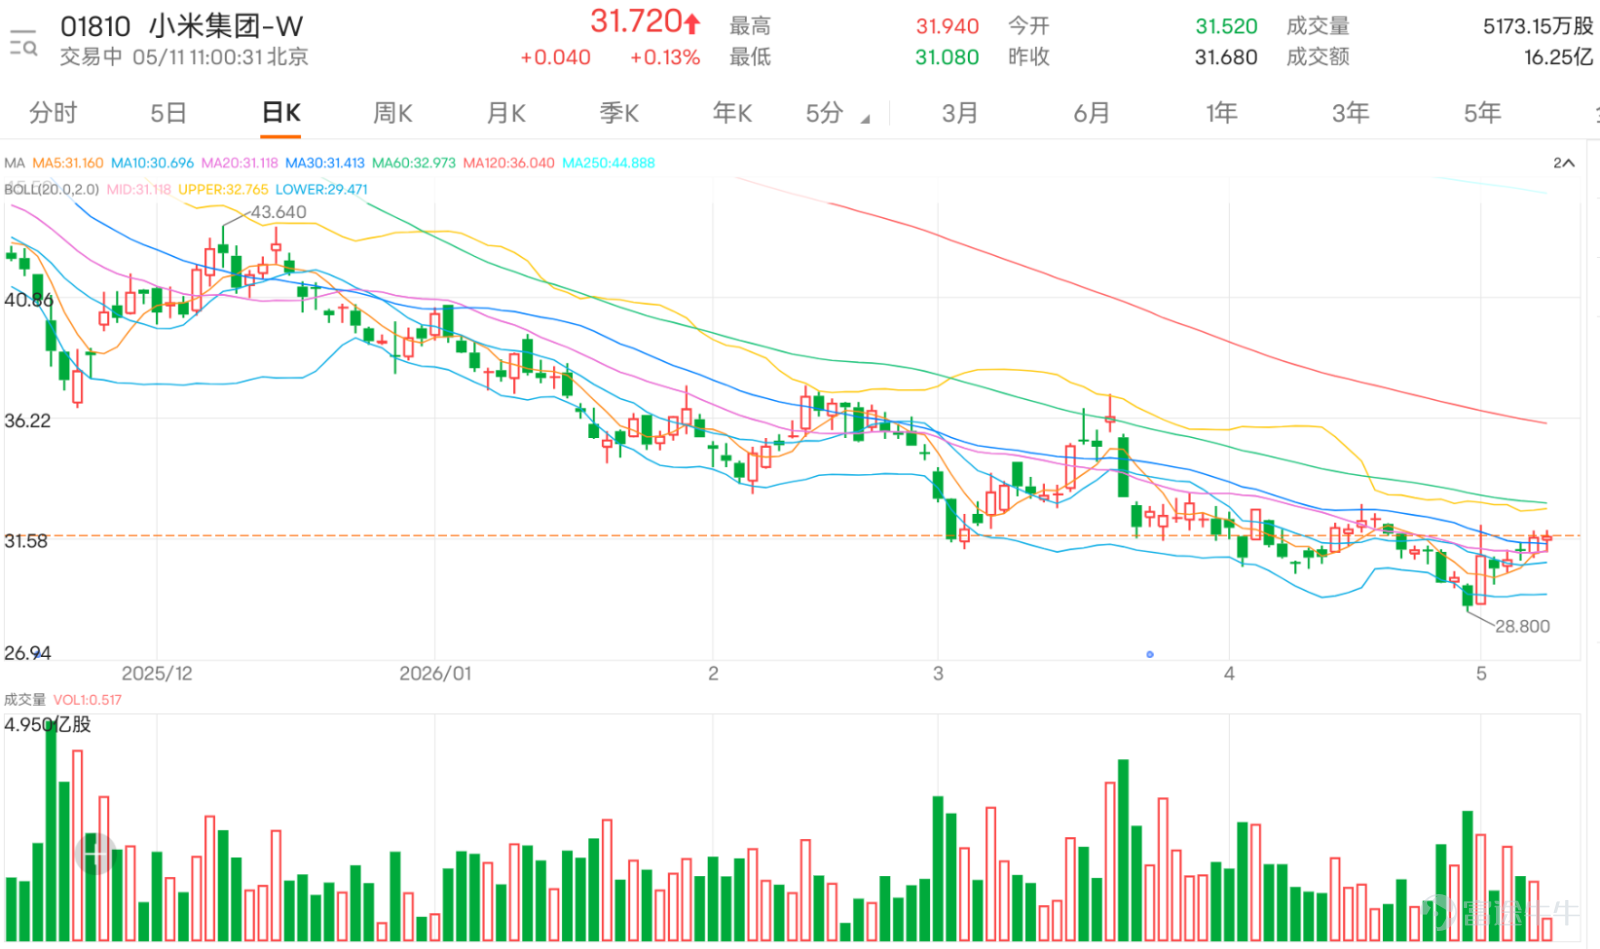
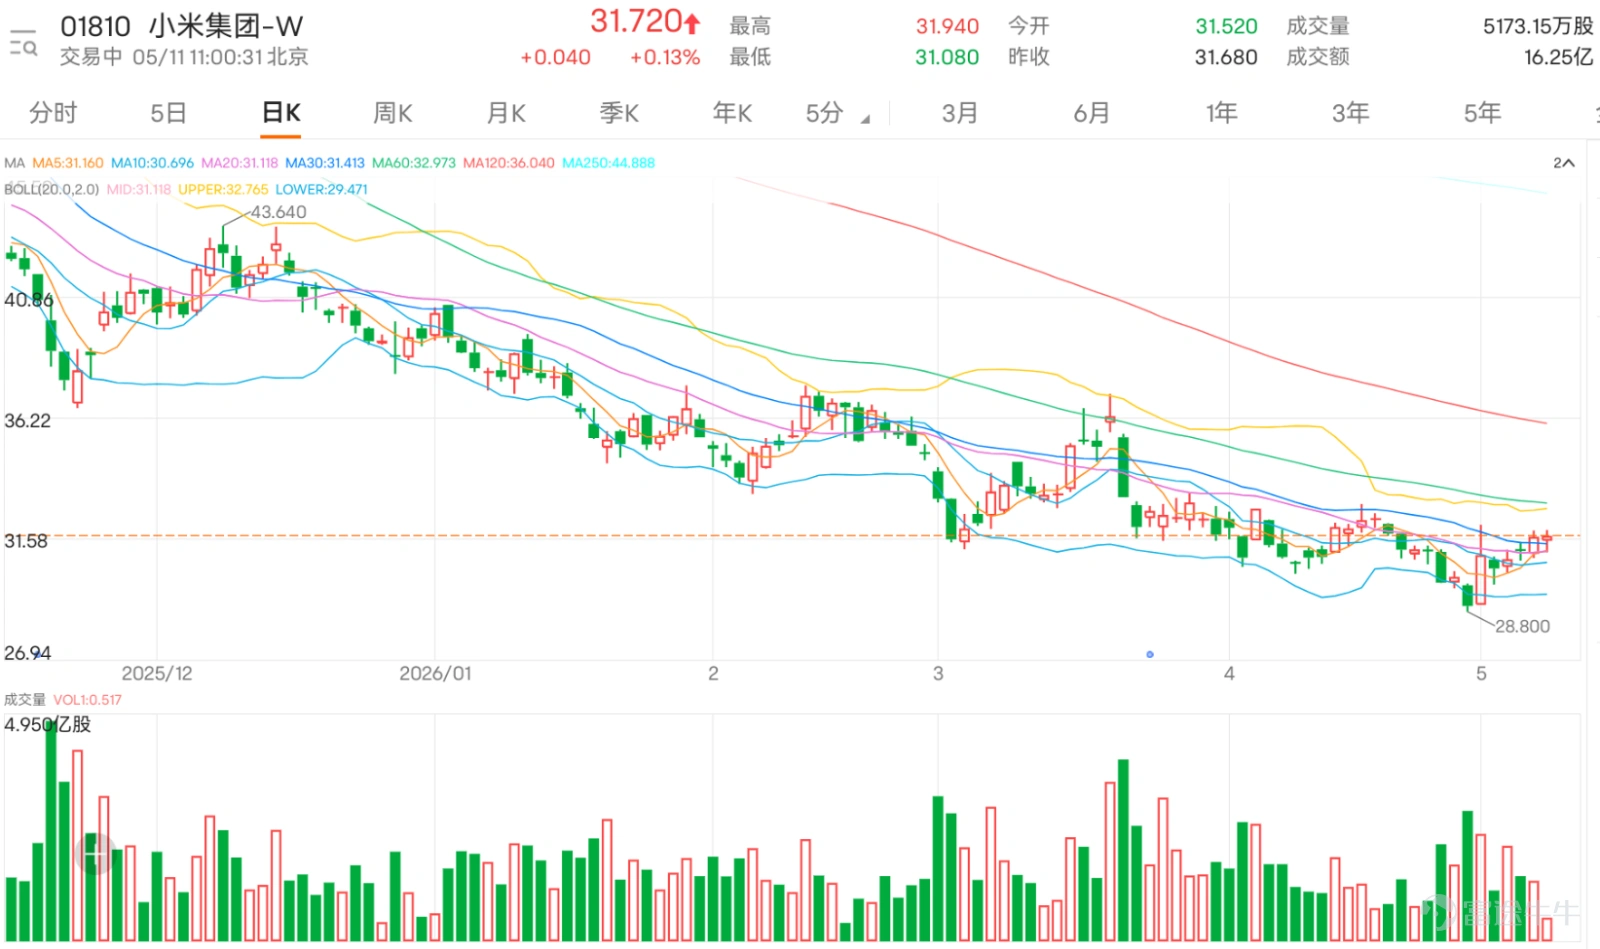
$XIAOMI-W (01810.HK)$ The stock price has recently been consolidating with fluctuations at lower levels. Xiaomi’s latest price is 31.76 yuan, up 0.13%. In terms of trend, the stock price is still constrained by the 60-day moving average at 33.03 yuan, and the medium-term trend has not yet reversed.
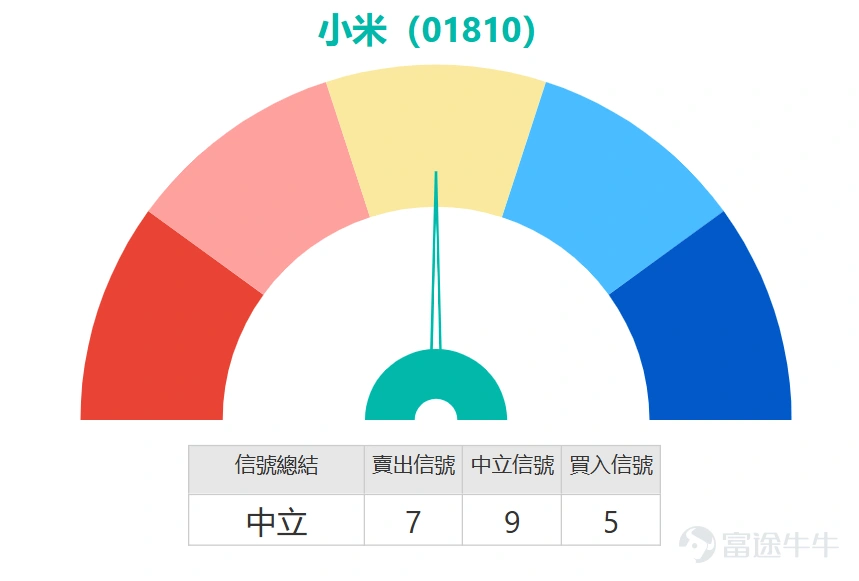
In terms of oscillation indicators, the Stochastic Oscillator (KDJ) has issued an overbought signal, suggesting possible technical pullback pressure in the short term. At the same time, the CCI indicator is also in an overbought state, further reinforcing the short-term sell warning. However, other momentum indicators provide a different perspective. Both the Momentum Oscillator and the Rate of Change indicator are issuing buy signals, while the MACD indicator’s fast and slow lines show a 'Golden Cross' pattern, providing momentum support for a potential bottom rebound. This divergence among indicators reflects current market disagreement: momentum is beginning to recover, but the price rebound has already reached the short-term overbought region.
In terms of support and resistance levels, the first support level is at 30.1 yuan, close to both the 10-day moving average and the psychological threshold of 30 yuan. If it holds steady, the short-term structure can be maintained. Stronger support lies at 29.1 yuan; if breached, new downward space may open. On the upside, the first key resistance is at 32.8 yuan, which coincides with the previous dense trading area and the upper Bollinger Band. A successful breakout could set the next target at 34.2 yuan, a critical step toward challenging the 60-day moving average and reversing the medium-term weakness.
Overall, Xiaomi's current technical picture exhibits characteristics of 'bottoming out and rebounding, but facing tests.' The stock price has found support near the 30-yuan mark and started to rebound, with improvements in momentum indicators being a positive sign. However, the rebound faces pressure from multiple moving averages, and some short-term oscillation indicators have entered overbought territory, meaning upward progress will not happen overnight and is more likely to fluctuate repeatedly before key resistance. For professional investors, this is not a clear trending buy point but rather an observation period for swing trading. Strategically, attention should focus on the stock's support near the first support level at 30.1 yuan. If the pullback holds without weakening momentum indicators, it could present a short-term tactical entry opportunity with a target towards the 32.8-yuan resistance zone. Conversely, if the stock breaks below the strong support at 29.1 yuan on heavy volume, one should be alert to the onset of a new round of declines.
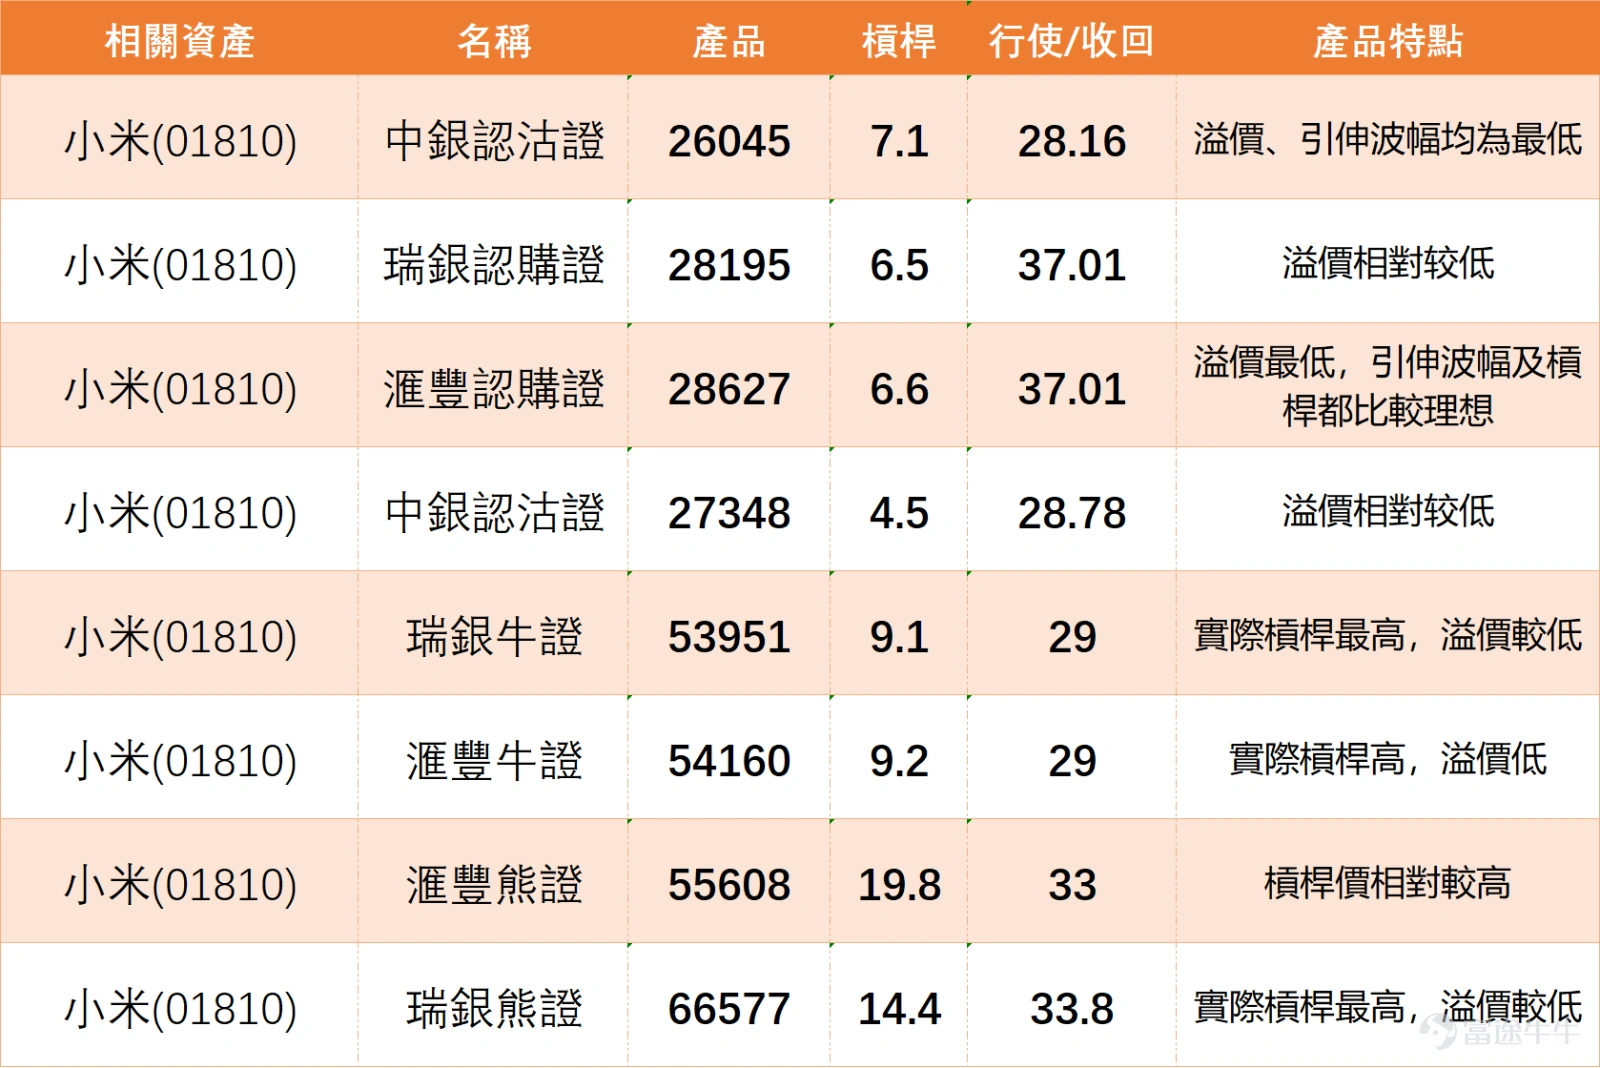
For call warrants, if you are optimistic about Xiaomi Group's future performance, you may consider $UBXIAMI@EC2609E.C (28195.HK)$ , its exercise price is 37.01 yuan, with leverage of approximately 6.5 times. Its advantage lies in relatively lower premium, helping to control holding costs. Another option is $HSXIAMI@EC2609E.C (28627.HK)$ , with the same exercise price of 37.01 yuan and leverage of about 6.6 times. This warrant has the lowest premium among comparable products, while its implied volatility and leverage levels are also relatively ideal, offering a better risk-return balance.
For put warrants, if you are cautious about the market outlook, you may look at $BIXIAMI@EP2608A.P (26045.HK)$ , with an exercise price of 28.16 yuan and leverage of about 7.1 times. Its key advantage is that both the premium and implied volatility are the lowest in its category, making it cost-effective for investors seeking hedging or who are bearish on the market. Another option is $BIXIAMI@EP2610B.P (27348.HK)$ , with an exercise price of 28.78 yuan and leverage of about 4.5 times. It also features a relatively low premium, providing investors with a more stable tool for bearish strategies.
For bull contracts, if you want to efficiently capture Xiaomi Group’s potential upside, you may focus on $UB#XIAMIRC2610D.C (53951.HK)$ , with a recovery price of 29 yuan and leverage of about 9.1 times. This product offers the highest actual leverage with a relatively low premium, making it suitable for aggressive investors. $HS#XIAMIRC2611K.C (54160.HK)$ , with the same recovery price of 29 yuan and leverage of about 9.2 times. It similarly boasts high actual leverage and a low premium, representing another highly efficient bullish choice.
For bear contracts, investors who are bearish on the market and want to utilize leverage may refer to $HS#XIAMIRP2811E.P (55608.HK)$The call price is 33 yuan, with a leverage of approximately 19.8 times. Its leverage price is relatively high, making it suitable for investors with strong confidence in a short-term pullback.$UB#XIAMIRP2812L.P (66577.HK)$The call price is 33.8 yuan, with a leverage of approximately 14.4 times. This warrant has the highest actual leverage among its peers and also offers a lower premium, providing an efficient bearish leverage tool.
Feel free to share your insights in the comment section. For more market analysis, stay tuned to 'HK Stock Warrants Jenny' for daily updates! $Hang Seng Index (800000.HK)$$Hang Seng TECH Index (800700.HK)$
Reminder: This article does not constitute any investment advice.
This article is for reference only and does not constitute any investment advice. Market data, opinions, and analysis contained herein may change at any time without prior notice. We are not responsible for any loss or damage caused by reliance on the information in this article. Technical analysis only shows whether certain technical conditions are met; asset performance should be comprehensively evaluated using other sources of information, and trading decisions should not be made solely based on this article. Please note that past performance is not indicative of future results.
#HKStocks #RealTimeAnalysis #WarrantPick #WarrantGuide #DerivativesHedging #HKWarrantsJenny #Xiaomi #0180 #BlueChipStocks #TechnicalAnalysis
Risk Disclaimer: The above content only represents the author's view. It does not represent any position or investment advice of Futu. Futu makes no representation or warranty.Read more

Comments
to post a comment
1