Zijin Mining remains range-bound, what are the rotation opportunities in the resources sector?
Last Friday (May 8), resource stocks performed differently, with $ZIJIN MINING (02899.HK)$
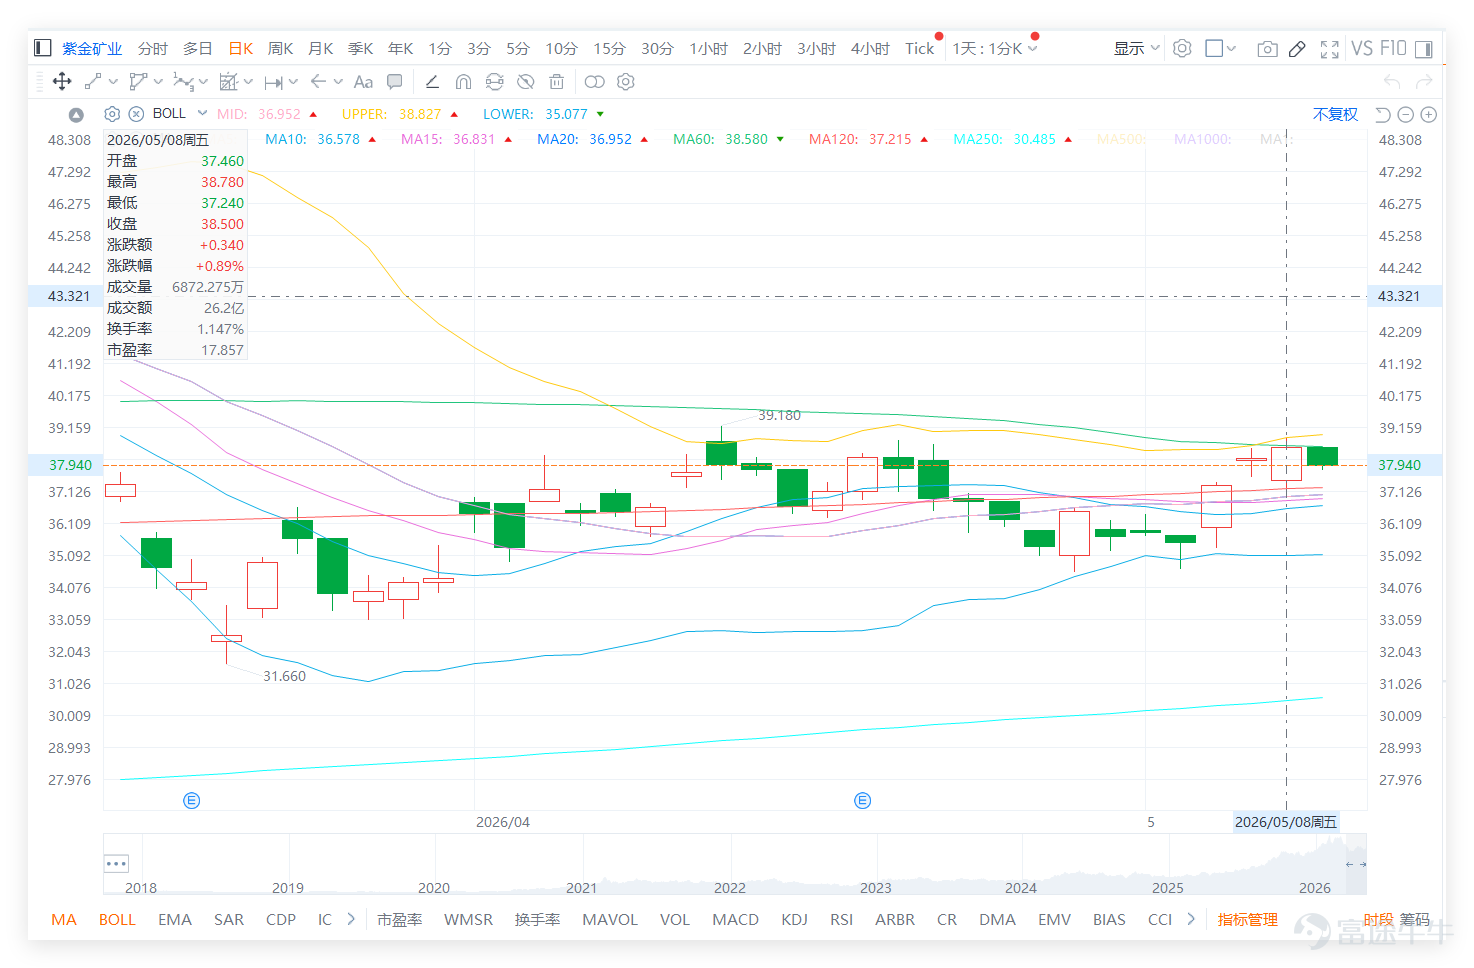
, recent performance can be described as "stable", with prices moving back and forth within a clear range. This seemingly quiet trend often contains clues for the next major price movement. On May 8, Zijin closed at 38.5 yuan, up slightly by 0.89% for the day, with a trading volume of 2.62 billion yuan, showing steady performance.

Highly converged moving averages: The current stock price is closely aligned with MA10 (36.58 yuan) and MA30 (36.38 yuan), fluctuating narrowly around MA60 (38.58 yuan). These three key moving averages are almost intertwined, forming a typical consolidation pattern where direction is yet to be determined.
Healthy momentum indicators: The daily RSI stands at 55, above the midpoint of 50 but far from the overbought zone, indicating that bullish and bearish forces have reached a relatively balanced state. Overall technical indicators suggest a "neutral" signal, confirming the current lack of a one-sided trend in the market.
Clear oscillation range: Upper resistance: Immediate resistance is at 39.6 yuan (Resistance 1); if there’s a breakout on high volume, it could challenge 41.1 yuan (Resistance 2), opening upside potential. Lower support: A solid support zone lies between 36.5 yuan (Support 1) and 35.9 yuan (Support 2). As long as this area holds firm, the overall structure remains intact.
Zijin Mining is currently trading within a "capped top and bottom" range. In this pattern, the upper and lower boundaries of the range become particularly critical. Investors need to be patient and wait for the price, accompanied by trading volume, to make a decisive breakout on either side.
Looking at the internal dynamics of the sector, funds seem to be switching between high and low: Zijin Mining: The technical signal is "neutral", with a stable trend, as if waiting for further guidance from gold, copper, and other commodity prices. $ZHAOJIN MINING (01818.HK)$ 、 $YANKUANG ENERGY (01171.HK)$ 、 $CNOOC (00883.HK)$ Similarly: Multiple stocks in the resources and energy sectors have unanimously shown a "buy" technical signal, with RSI generally below 50. This usually indicates that they have undergone prior adjustments, making the technical conditions for a short-term rebound more favorable.

This reveals an interesting phenomenon: The leading stock (Zijin Mining) is consolidating while some peers in the same sector are already signaling technical rebounds. This may foreshadow rotation opportunities within the sector or indicate that the broader market movement awaits the leader stock’s directional choice.
Reference for structured products such as bull/bear contracts:
When the underlying stock is in a well-defined oscillation range, derivative strategies can be more flexible, but the key is to closely monitor breakouts at the range boundaries or the effectiveness of support/resistance levels.
1. Breakout strategy reference: If anticipating that the stock price will choose to break out upwards, investors may consider call warrants with strike prices slightly higher than the current price and low premiums, such as $MSZIJIN@EC2612A.C (25749.HK)$ , which has the lowest premium and implied volatility among similar products, with relatively moderate time decay.
2. Reference for range or pullback strategy: If the stock price is expected to fluctuate within a range or pull back to the lower boundary of the range, relevant products can be considered. For instance, $UB#ZIJINRP2812I.P (57819.HK)$with a recovery price of $42, offering relatively high actual leverage. However, note that it is closer to the current price, making it highly sensitive to short-term fluctuations.

Important Reminder: In a volatile market, CBBCs (Callable Bull/Bear Contracts) face significant time decay impacts, while bull/bear contracts must focus on preventing the risk of being triggered by price fluctuations near the range boundaries. Any strategy should be based on key signals of breaking through or falling below the range, rather than frequently trading in uncertain areas.
For more market analysis, stay tuned to Jenny's daily updates on 'Hong Kong Stock Warrants'!
Reminder: This article does not constitute any investment advice.
This article is for reference only and does not constitute any investment advice. Market data, opinions, and analysis contained herein may change at any time without prior notice. We are not responsible for any loss or damage caused by reliance on the information in this article. Technical analysis only shows whether certain technical conditions are met; asset performance should be comprehensively evaluated using other sources of information, and trading decisions should not be made solely based on this article. Please note that past performance is not indicative of future results.
Hong Kong Stocks #Real-Time Analysis #Warrant Picks #Warrant Guide #Derivatives Hedging #Hong Kong Stock Technical Analysis #Zijin Mining #Resource Stocks #Technical Analysis
Risk Disclaimer: The above content only represents the author's view. It does not represent any position or investment advice of Futu. Futu makes no representation or warranty.Read more
Comments
to post a comment