After Baidu's RSI reached 71, a pullback was confirmed, falling nearly 4% below 140. Short-term support is seen at 127 yuan.
Last Friday (8th) $BIDU-SW (09888.HK)$
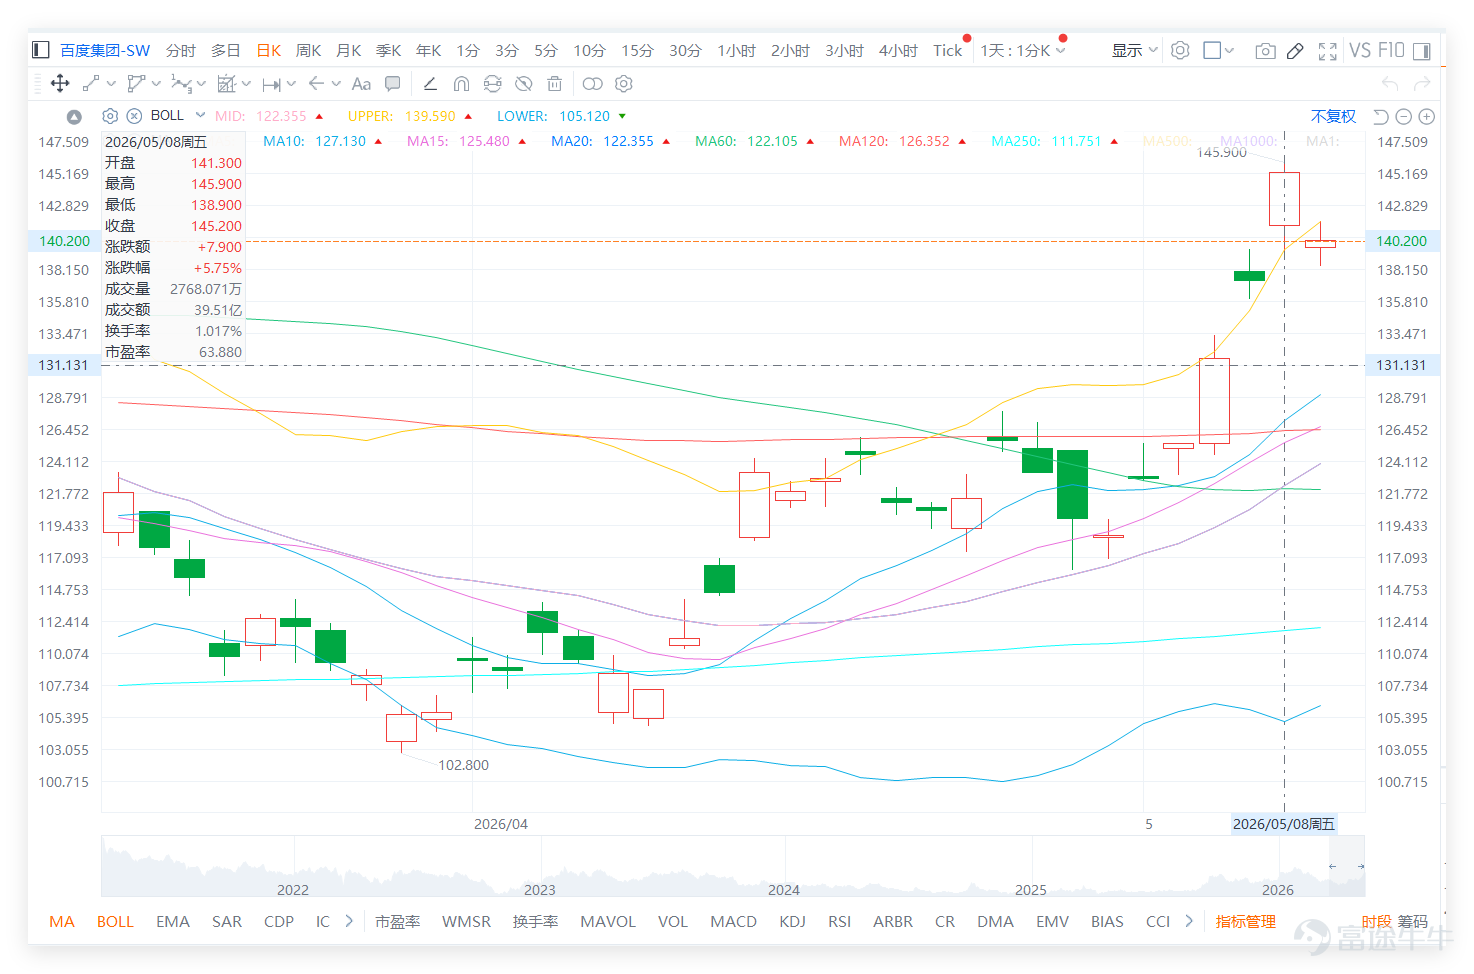
A single-day surge of nearly 6% was very eye-catching. However, when the stock price rises sharply and indicators enter the overbought zone, it’s time to calmly review the technical charts. Looking back, Baidu closed at 145.2 yuan last Friday, up 5.75%, with a trading volume of 3.951 billion yuan, showing good price-volume coordination.
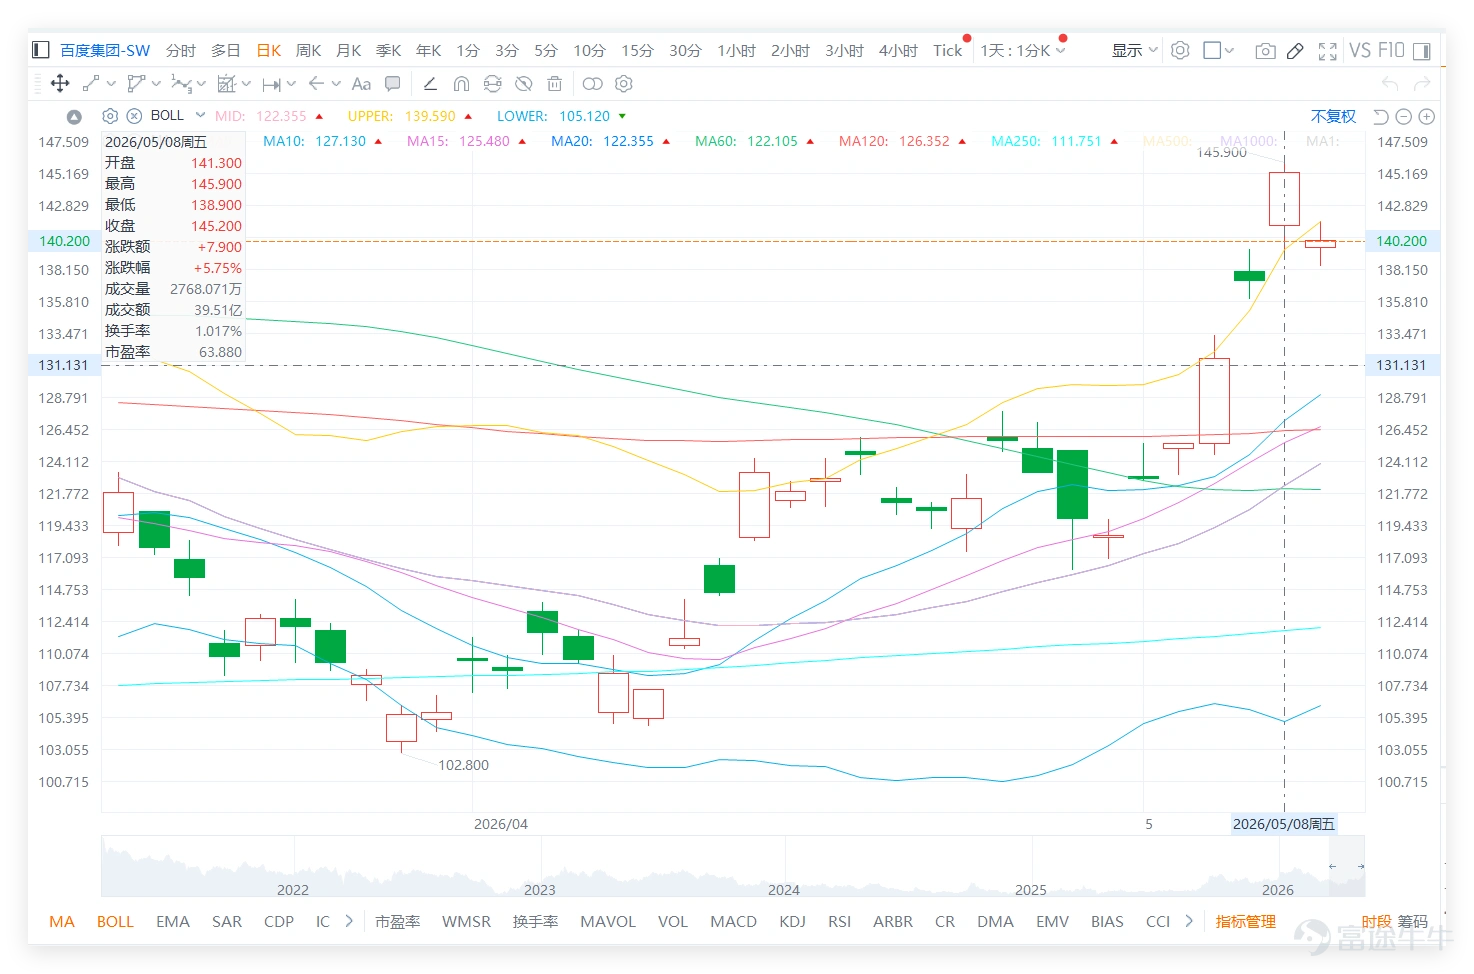
Strong moving average breakout: The stock price has surged significantly above MA10 (127.13 yuan) and MA30 (118.01 yuan), presenting a strong bullish alignment. This indicates a robust mid-term upward trend.
Clear overbought signal: The most critical indicator to watch now is the daily RSI, which has reached 71, clearly entering the "overbought" zone in traditional technical analysis. This usually means that short-term buying power may have been overextended, and resistance for further sharp rises at current levels will increase.
Key resistance and support: Immediate resistance is 152.7 yuan (Resistance 1), which is the key near-term resistance level. A successful breakout with volume could lead to the next target at 163.6 yuan (Resistance 2). Short-term support lies near MA10 (127.13 yuan), with stronger support around 120.2 yuan (Support 2).
Baidu's mid-term trend is undoubtedly strong. However, in the short term, the RSI showing an overbought condition is a technical correction signal that needs attention. Investors should focus on the stock’s performance near the critical resistance at 152.7 yuan and monitor buying interest around MA10 in case of a pullback.
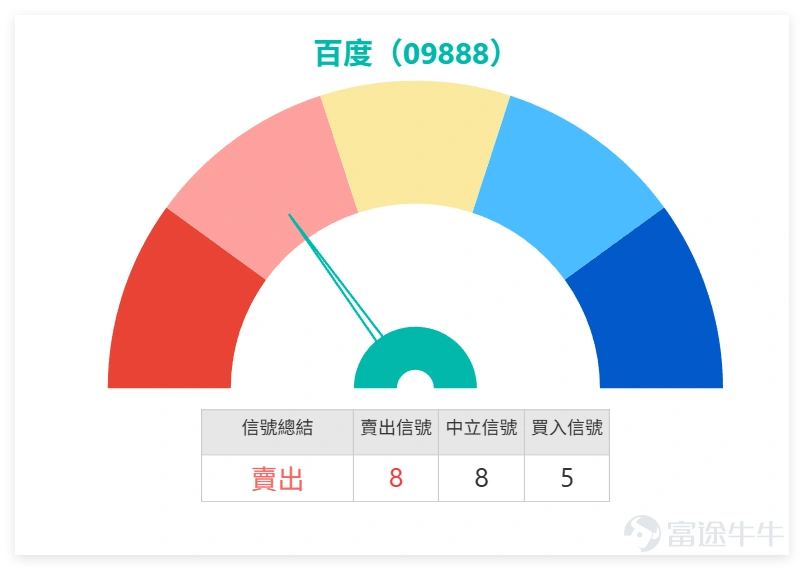
Looking at Baidu within its sector reveals an interesting situation: $TENCENT (00700.HK)$ : The trend is relatively neutral, with an RSI of 40, signaling "neutral" technical conditions, reflecting possible investor hesitation. $MEITUAN-W (03690.HK)$ 、 $JD-SW (09618.HK)$ 、 $NTES-S (09999.HK)$ : Although the stock price has rebounded recently, all technical signals are showing "sell," indicating the rebound lacks a solid technical foundation.
This shows that the current rise in the technology sector is not broad-based, with funds concentrated in a few stocks like Baidu. In this structure, the movement of leading stocks significantly impacts sector sentiment, but if the leader experiences a technical pullback, caution against sector-wide pressure is warranted.
Reference for structured product strategies (e.g., warrants, bull/bear contracts):
When the underlying stock is in a conflicting position of 'strong trend' and 'high RSI,' choosing derivative instruments requires more refined risk management thinking.
If you still believe in the upward trend but are concerned about high volatility, consider deploying products with more conservative terms, such as:
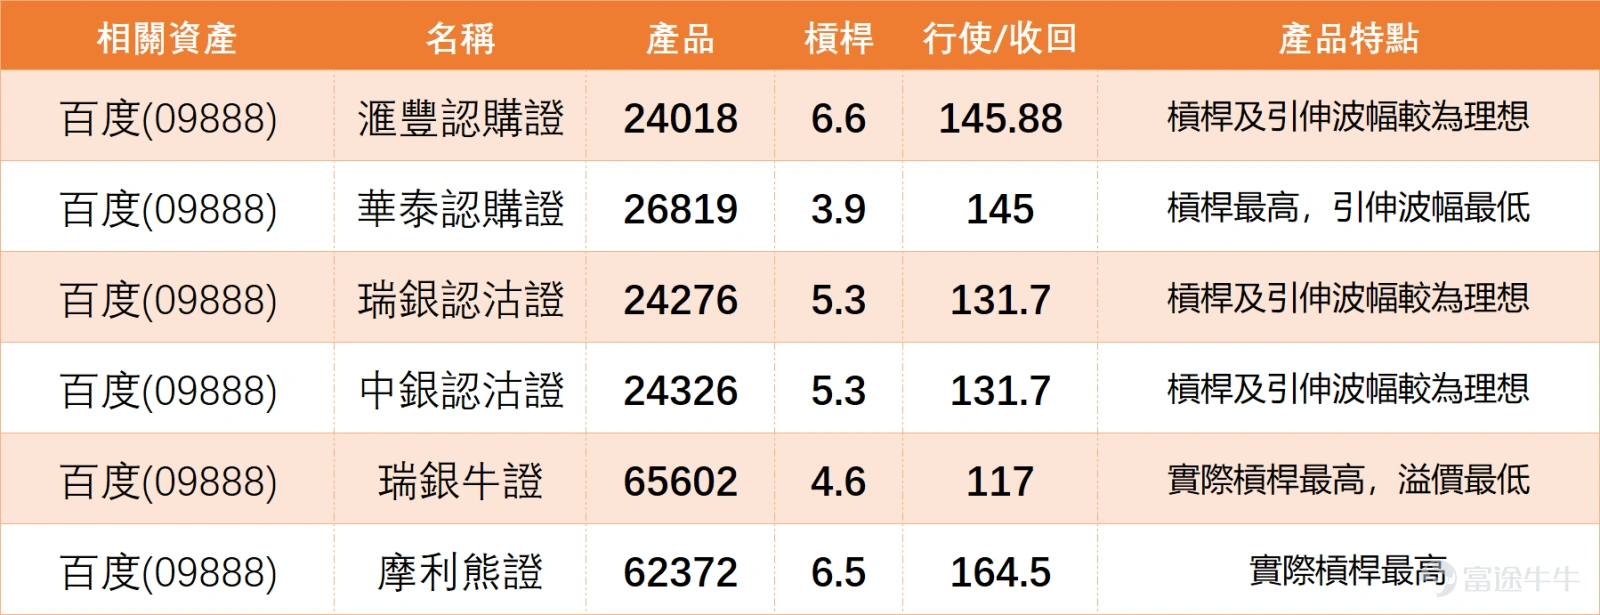
1. Bullish strategy reference: pay attention to$HSBAIDU@EC2607B.C (24018.HK)$, with a strike price of 145.88 yuan. Its leverage and implied volatility are relatively balanced, and it may be less sensitive to fluctuations.
2. Bearish or hedging strategy reference: pay attention to$MS#BAIDURP2612B.P (62372.HK)$, with a call price of 164.5 yuan, offering higher actual leverage, suitable for short-term adjustments.
Important reminder: Opening positions when stock prices have surged significantly and are approaching resistance levels carries higher risk regardless of being bullish or bearish. Bull and bear certificates carry mandatory recall risks; it is essential to closely monitor their distance from the current price. All derivative investments require strict discipline, and heavy positions are strongly discouraged.
For more market analysis, stay tuned to Jenny's daily updates on 'Hong Kong Stock Warrants'!
Reminder: This article does not constitute any investment advice.
This article is for reference only and does not constitute any investment advice. Market data, opinions, and analysis contained herein may change at any time without prior notice. We are not responsible for any loss or damage caused by reliance on the information in this article. Technical analysis only shows whether certain technical conditions are met; asset performance should be comprehensively evaluated using other sources of information, and trading decisions should not be made solely based on this article. Please note that past performance is not indicative of future results.
#HKStocks #RealTimeAnalysis #WarrantSelection #WarrantGuide #DerivativesHedging #HKStocksTechnicalAnalysis #Baidu #TechStocks #TechnicalAnalysis #RiskManagement
Risk Disclaimer: The above content only represents the author's view. It does not represent any position or investment advice of Futu. Futu makes no representation or warranty.Read more

Comments
to post a comment
2
2