Alibaba Short-Term Signal Analysis: How to Position Before Earnings?
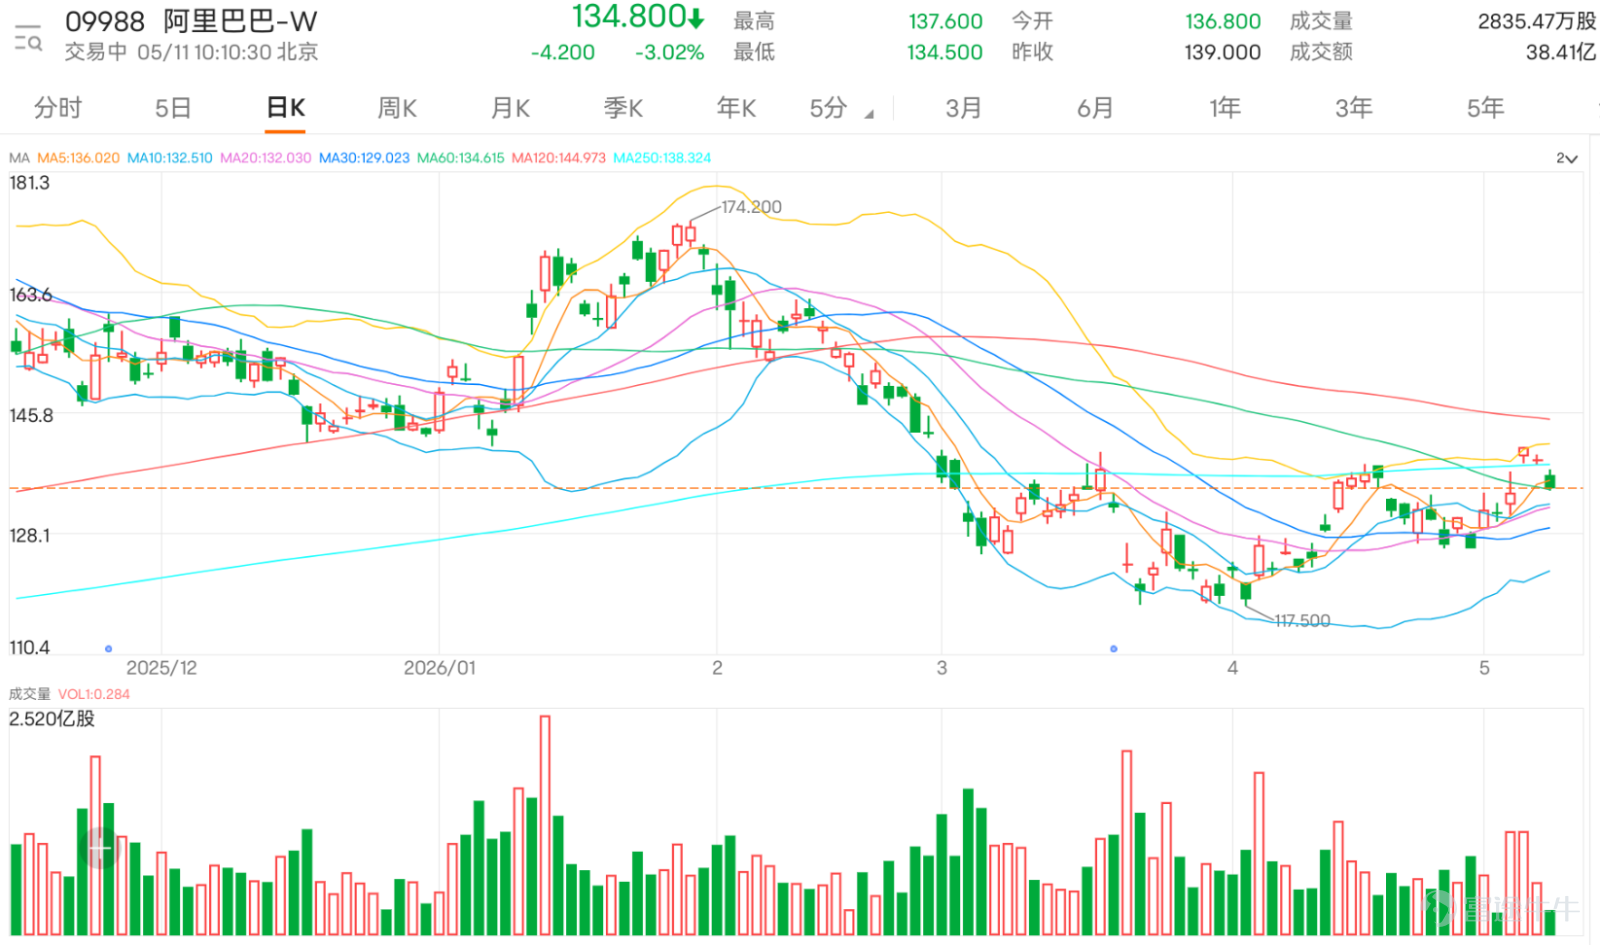
$BABA-W (09988.HK)$ The latest price is 134.8 yuan, down more than 3%. Observing the moving average system, the current stock price is above the 10-day moving average (132.21 yuan) and the 30-day moving average (128.64 yuan), indicating that short-term rebound momentum remains intact. However, the stock price is currently locked in a tug-of-war with the 60-day moving average (135.03 yuan). This mid-term average cost line has become the core node contested by both bulls and bears, offering directional significance for subsequent movements. This pattern shows that after a strong start in early May, the stock price is attempting to challenge and stabilize above the more critical mid-term cost line, though the process has not been smooth sailing.
In-depth analysis of key technical indicators reveals complex divergence in market sentiment. On one hand, multiple oscillation indicators have issued strong warning signals. Both the Stochastic Oscillator and the CCI indicator are showing clear 'sell' signals, suggesting the stock has entered an overbought zone in the short term, facing pressure for a technical pullback. The Williams %R indicator is also in an overbought state, further supporting the view that short-term momentum may be overheated. Meanwhile, the RSI value stands at 62, which, although not extremely overbought, is on the edge of the bullish region, with the RSI indicator signal being 'neutral,' hinting that upward momentum may be weakening, with bulls and bears tending toward equilibrium.
However, trend-following indicators paint a different picture. Both the MACD indicator and the Ichimoku Cloud are issuing 'buy' signals, suggesting that from a medium-term trend perspective, momentum may be shifting from weak to strong. Bollinger Bands also suggest a 'buy' outlook, implying that stock price fluctuations remain within the normal range of the channel, with no extreme conditions observed. This divergence, where oscillation indicators point to bearishness while trend indicators favor bullishness, reflects typical technical characteristics when prices are at a critical juncture for direction selection.
Synthesizing the technical chart, Alibaba's key price levels are clearly visible. The first support level below is at 132 yuan, coinciding with the 10-day moving average, acting as an important defense line for short-term bulls. The second support level is at 125.7 yuan, where support is stronger. Above, the first resistance level is at 143.6 yuan, and if broken through, it will challenge the second resistance level at 148.2 yuan.


Summary Analysis and Trading Strategy
As Alibaba's stock price approaches the intersection of 'expectation game' and 'technical correction' ahead of the FY2026 earnings announcement on May 13, multiple leading oscillation indicators (such as the Stochastic Oscillator and CCI) have collectively issued overbought sell signals. This serves as a short-term risk warning that cannot be ignored, indicating that capital chasing highs before the earnings report may face profit-taking pressures. There is a high probability that the stock will experience pullback fluctuations near the support level of $132 below the resistance level of $143.6 in the short term.
However, buy signals from trend indicators like MACD, along with market optimism about accelerated growth in its cloud business and narrowing losses, provide potential mid-term support. For professional investors, this is not a clear one-way trading opportunity but rather a window requiring refined positioning.
A feasible short-term strategy is: if the stock price pulls back to around $132 (first support level) due to technical overbought conditions, accompanied by shrinking trading volume and corrected overbought oscillation indicators, it can be considered a tactical buying opportunity based on earnings expectations and trend support, with a target看向 (target looking at) the resistance level of $143.6. Conversely, if the stock price ignores the overbought signals and forcefully breaks through $143.6 with increased volume, attention should be paid to whether it can effectively hold above the 60-day moving average and open up upside space towards $148.2. Before the earnings report drops, controlling position size, closely monitoring key levels ($132, $143.6), and observing whether oscillation indicators retreat from the overbought zone are core priorities for handling the current divergence between bullish and bearish signals.
For investors optimistic about Alibaba’s future performance and expecting the stock price to break above the current resistance level of approximately $143.6, call warrants with a strike price of $150.09 could be considered. $BIALIBA@EC2608E.C (26562.HK)$ These offer about 6.5x leverage, with the lowest premium and implied volatility among similar strike-price products, effectively reducing holding costs and time decay. $HSALIBA@EC2608F.C (26604.HK)$ Another option provides about 6.4x leverage, also featuring relatively low premiums, making it a choice for pursuing lower-cost bullish bets.
If you are bearish on the outlook and believe the stock price might retrace to test the $132 support level or even lower, put warrants can be considered. $BPALIBA@EP2607A.P (20561.HK)$ Those with a strike price of $128.88 offer about 8.4x leverage, featuring the lowest premium and ideal implied volatility and leverage balance, optimizing cost versus potential return. $HSALIBA@EP2607A.P (26071.HK)$ Another option, with a strike price of $127.28 and leverage of about 7.3x, stands out for having the lowest implied volatility among peers, helping mitigate price impacts from volatility changes while still offering solid leverage.
For investors seeking directional plays with lower premiums and higher leverage, bull/bear contracts present another alternative. Bullish investors may consider bull contracts. $UB#ALIBARC2610J.C (69165.HK)$ The call price is 130 yuan, with an actual leverage of approximately 12.3 times, and the lowest premium; $JP#ALIBARC26112.C (53568.HK)$ The call price is 132 yuan, with an even higher actual leverage of about 14.5 times and a low premium, suitable for aggressive investors who are bullish, but be aware of the risk that the call price is relatively close to the current price.
Investors who are bearish may consider bear certificates, $UB#ALIBARP2810G.P (69096.HK)$ The call price is 145 yuan, offering a high actual leverage of about 20.7 times with a low premium; $JP#ALIBARP2809J.P (57970.HK)$ ) The call price is 149 yuan, with an actual leverage of about 13.9 times, making it the highest leverage and lowest premium bear certificate in the list, suitable for investors who expect the stock price to struggle breaking through and might turn downward.

Feel free to share your insights in the comment section. For more market analysis, please continue following ‘Hong Kong Stock Warrants Jenny’ for daily updates!
Reminder: This article does not constitute any investment advice.
This article is for reference only and does not constitute any investment advice. Market data, opinions, and analysis contained herein may change at any time without prior notice. We are not responsible for any loss or damage caused by reliance on the information in this article. Technical analysis only shows whether certain technical conditions are met; asset performance should be comprehensively evaluated using other sources of information, and trading decisions should not be made solely based on this article. Please note that past performance is not indicative of future results.
#HKStocks #Real-TimeAnalysis #WarrantPick #WarrantGuide #DerivativesHedging #HKWarrantsJenny #Alibaba #09988 #Blue-ChipStocks #TechnicalAnalysis$Hang Seng Index (800000.HK)$$Hang Seng TECH Index (800700.HK)$
Risk Disclaimer: The above content only represents the author's view. It does not represent any position or investment advice of Futu. Futu makes no representation or warranty.Read more
Comment (1)
to post a comment