Short-term Hang Seng Index Trading: Increasing divergence in technical signals, with the 26,000-point level becoming the frontline for a bullish-bearish showdown
$Hang Seng Index (800000.HK)$ In recent volatility, signs of fatigue have emerged. The index fell 0.87% the previous day, closing at 26,393.71 points, unable to hold above the psychological level of 26,500 points. Although the latest price remains above the 10-day (26,070.01 points), 30-day (25,778.62 points), and 60-day (25,966.00 points) moving averages, forming a short-term bullish alignment, the index has been stuck in a narrow range for several consecutive days, with a 5-day fluctuation reaching 3.7%, indicating that bulls and bears are deadlocked at the current level.
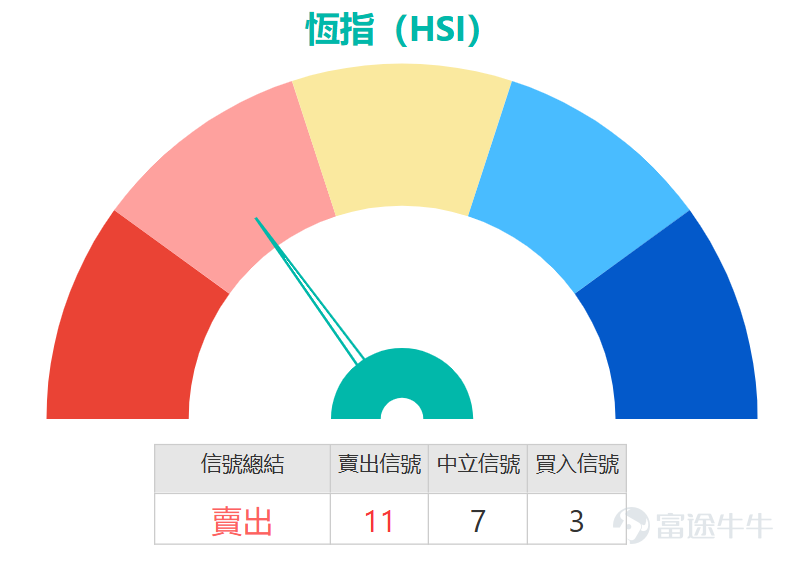
From the perspective of key technical indicators, there are significant divergences in market signals, increasing the difficulty of short-term trading. In terms of oscillation indicators, both the Stochastic Oscillator and CCI indicator issued 'sell signals,' suggesting that short-term momentum may be transitioning from strong to weak, with prices under pressure to correct. However, the MACD signal shows 'buy,' while the Bollinger Bands indicate a 'buy' signal, with the index price hovering near the upper side of the middle band, showing that the medium-term trend is not entirely bearish. This divergence often signals that the market is at a crucial turning point. Other indicators like RSI (56) and Williams %R remain in the 'neutral' zone, neither overbought nor oversold, failing to provide clear directional guidance.
Currently, the first key support level has shifted upward to 25,900 points (close to the 10-day moving average). If this position is breached, it could quickly test the second support level at 25,472 points (also a significant recent low area). The upside resistance is clear, with 26,738 points being the initial strong resistance. If volume supports a breakout, the index could further target the higher resistance zone around 27,049 points. Notably, the previous day’s trading volume of nearly 280 billion Hong Kong dollars indicates relatively active market turnover, but failed to push the index higher, reflecting persistent selling pressure at higher levels.
In summary, the short-term technical landscape of the Hang Seng Index reflects a pattern of 'momentum divergence, range-bound awaiting breakout.' Sell signals from various oscillation indicators offset buy signals from MACD and Bollinger Bands, reducing any certainty of a one-sided move. The index is currently testing the effectiveness of the short-term moving average system's support. For professional investors, it is not advisable to make large directional bets at this moment. A more prudent strategy would be to wait for the market to make a clear choice at key price levels: if the index can break through the 26,738-point resistance with strong volume, the technical divergence may be resolved, allowing short-term traders to follow the trend; conversely, if the support at 25,900 points is broken, multiple indicators’ sell warnings will intensify, potentially exacerbating downward pressure. Until the signals align, adopting high-sell-low-buy tactics within the range or strictly controlling position sizes through observation would be more cautious approaches.


The Hang Seng Index is currently at a technical key level, with mixed bullish-bearish signals. Below are selected warrant and bull/bear certificate products covering call options, put options, bull certificates, and bear certificates across four categories, helping you deploy short-term opportunities in different market conditions:
For call warrants, consider paying attention to $JP-HSI @EC2608B.C (26361.HK)$ The strike price is set at 28,500 points. This product stands out for having the highest leverage level (15.1 times) on the list, while also offering relatively the lowest premium and implied volatility. It is suitable for investors who are optimistic about the market outlook and believe the index can break through the resistance level of 26,738 points, allowing them to capitalize on the upward movement with relatively low cost.
For put warrants, there are two products worth considering. One of them is $FCN 261103-132 COIN+HOOD (XS3344264919.SN)$ with a strike price of 24,378 points, offering approximately 11.3 times leverage; the other option is $UB-HSI @EP2608A.P (26468.HK)$ also with a strike price of 24,378 points and leverage of around 11.1 times. Both have relatively high leverage levels and are suitable for investors who believe the index may fall below the support level of 25,900 points and adjust downward, serving as a hedge or bearish strategy.
For bull contracts, two choices with similar stop-loss levels are available. $BI#HSI RC2809G.C (56831.HK)$ The stop-loss level is at 25,295 points, with leverage of approximately 23.8 times; whereas $BI#HSI RC28092.C (55956.HK)$ the stop-loss level is slightly higher at 25,395 points, with leverage of around 26.4 times. The latter offers slightly higher leverage. These two products are suitable for investors who believe that the support at 25,900 points or 25,472 points is strong and that the index will rebound, though attention must be paid to stop-loss risk.
For bear contracts, there are similarly two products. $BI#HSI RP2803D.P (59692.HK)$ The stop-loss level is set at 27,350 points, with leverage of approximately 23 times; $BI#HSI RP2803A.P (62631.HK)$ the stop-loss level is slightly higher at 27,398 points, with leverage of around 22 times. Both have relatively high leverage and are suitable for investors who expect the index to encounter resistance at either 26,738 points or 27,049 points and subsequently decline, allowing for range trading with a bearish bias. However, strict control over stop-loss risk is necessary.

Feel free to share your insights in the comment section. For more market analysis, please continue following ‘Hong Kong Stock Warrants Jenny’ for daily updates!
Reminder: This article does not constitute any investment advice.
This article is for reference only and does not constitute any investment advice. Market data, opinions, and analysis contained herein may change at any time without prior notice. We are not responsible for any loss or damage caused by reliance on the information in this article. Technical analysis only shows whether certain technical conditions are met; asset performance should be comprehensively evaluated using other sources of information, and trading decisions should not be made solely based on this article. Please note that past performance is not indicative of future results.
#HKStocks #RealTimeAnalysis #WarrantPick #WarrantGuide #DerivativesHedging #HKWarrantsJenny #HangSengIndex #HangSengTechIndex #BlueChipStocks #TechnicalAnalysis$Hang Seng Index (800000.HK)$$Hang Seng TECH Index (800700.HK)$$Hang Seng China Enterprises Index (800100.HK)$
Risk Disclaimer: The above content only represents the author's view. It does not represent any position or investment advice of Futu. Futu makes no representation or warranty.Read more

Comments
to post a comment
4