
Hong Kong stocks pull back—how will they perform in the second half of the year?
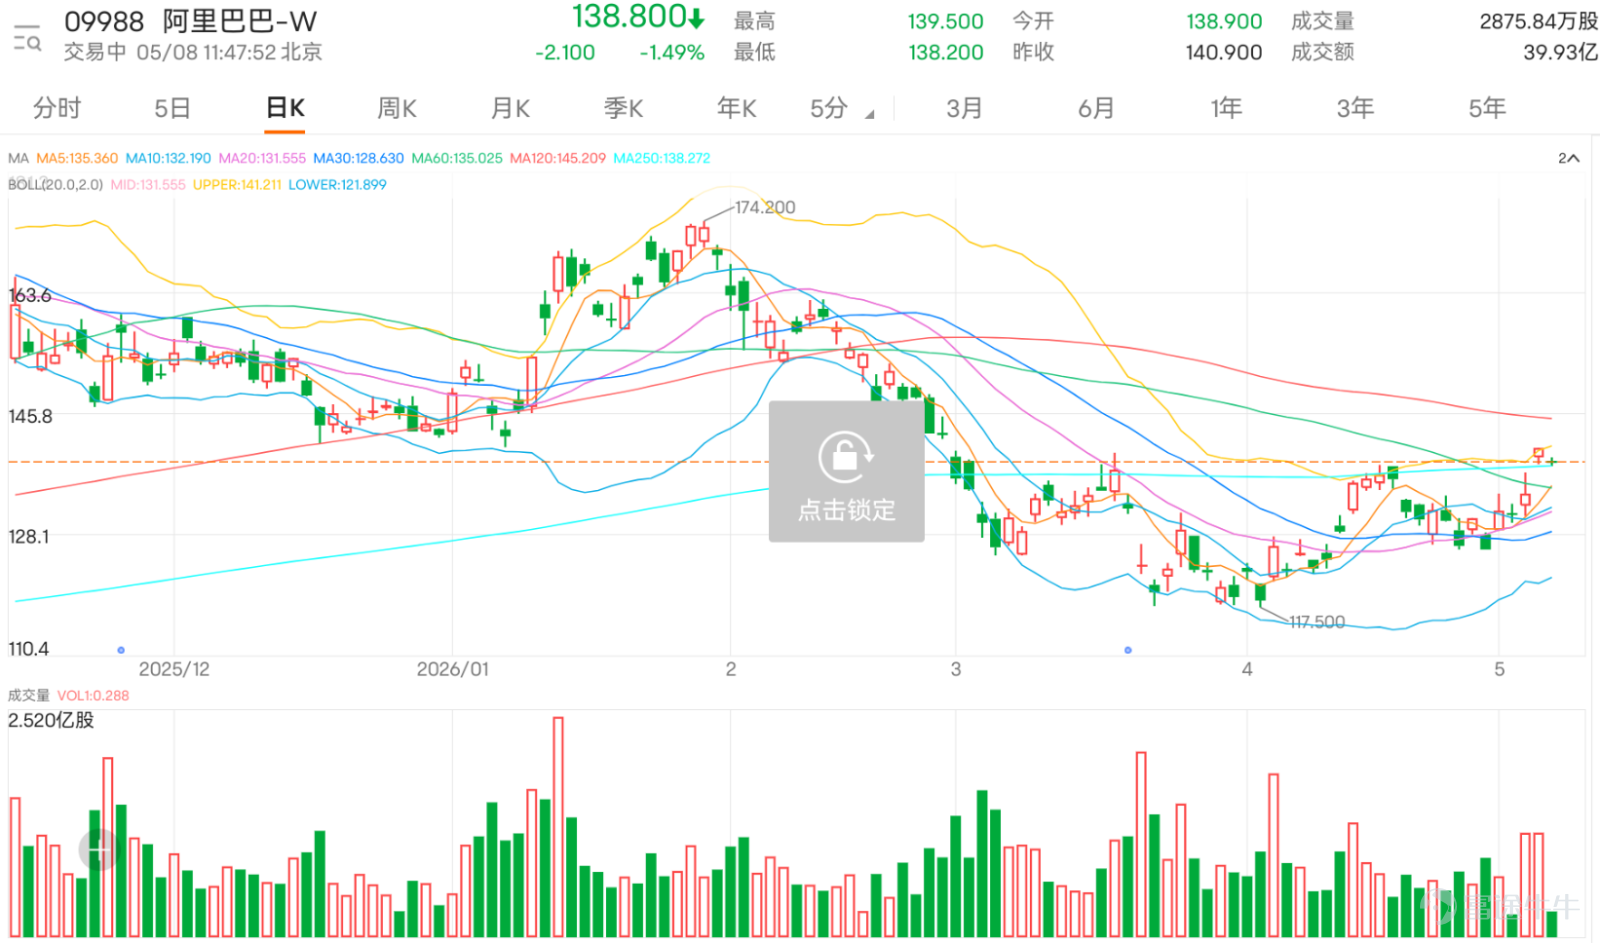
At the Crossroads After Breaking Through the Annual Line: Will Alibaba's Rebound Continue or Return to Volatility? 141.23 is the Key
$BABA-W (09988.HK)$ Current price at 138.7 yuan, slightly below the upper Bollinger Band at 141.23. The stock price is holding steady above the 10-day line at 131.350, the 20-day line at 130.760, the 30-day line at 127.993, and the 250-day line at 138.273, indicating a clear short-term rebound trend, but the mid-term trend has not fully reversed yet.
From the comments, it is evident that market sentiment has shifted towards optimism, with many investors starting to focus on targets of 150, 160, or even higher. Some investors believe that Alibaba could return above 160, while others are looking forward to a challenge of 200 this year, showing that after breaking through 140, the market's imagination for upside potential has reopened. Comments also mentioned 'rapid rise' and the strength of tech stocks, indicating that this rebound is not only about individual stock recovery but also driven by the overall positive sentiment in the tech sector.
However, as optimism rises, caution is also beginning to emerge in the market. Some investors think the volume is still insufficient, while others worry about the rapid rise and even hope they won't be called out. This reflects that some holders are not just chasing the uptrend but are concerned about whether the rally is too fast and sustainable. Some comments noted that recent performance is still poor, suggesting that the market's medium-term confidence in Alibaba has not fully recovered.
Common questions focus on whether 140 can hold steady and whether 150 will be reached soon. Technically, 141.23 serves as the short-term watershed. As long as the stock price can stabilize above it, the short-term uptrend can continue, with 150 becoming a closer psychological threshold. Above 160 would represent a further extension after the breakout. However, the Relative Strength Index (RSI) is around 73.214, showing that momentum has entered an overheated zone, indicating rising risks of chasing the stock.
Overall, Alibaba is currently in a relatively strong position following the breakout, but it's not an ideal low-risk entry point. If it can break through and stabilize above 141.23, there is a short-term opportunity to break through the key mid-term resistance at 145-146 yuan, potentially moving toward 160 yuan. If it falls back below 141.23, it means the breakout needs to be reconfirmed, and the stock price may consolidate in the range of 130.760 to 135.4. At this stage, a more reasonable strategy for holders is to observe whether 141.236 can hold, while those looking to buy should avoid being overly aggressive after a sharp rise.
Key Strategy: Holding above 141.23 could lead to testing 174.200, with potential to chase the upward trend upon breakout; if 141.23 fails, look for consolidation between 130.760 and 135.4.
Strategy One | Breakout Trend Following
$GJALIBA@EC2609B.C (27054.HK)$ |Strike Price 145.98|Actual Leverage 5.8x|Close to current price on the upside, suitable for chasing the trend immediately after the breakout, quick reaction, high flexibility
$UBALIBA@EC2609D.C (27403.HK)$ |Strike Price 166.98|Actual Leverage 6.0x|Provides medium-term space, suitable for swing trading strategies expecting continued upward momentum post-breakout
$UBALIBA@EC2609C.C (26839.HK)$ | Strike price 183.98 | Actual leverage 6.3 times | Higher target, suitable for aggressive allocation expecting an upward trend to extend into the mid-term range
Strategy Two | Deploying at Retested Support Levels
$UBALIBA@EC2609B.C (26544.HK)$ | Strike price 145.98 | Actual leverage 5.5 times | Close to the watershed, suitable for accumulation upon pullback confirmation without breakdown
$UBALIBA@EC2608F.C (26538.HK)$ | Strike price 150.09 | Actual leverage 6.3 times | Balanced leverage and distance, suitable for capturing rebounds after a pullback
$UBALIBA@EC2612A.C (25394.HK)$ | Strike price 215.88 | Actual leverage 5.3 times | Further distance, suitable for stable holding to reduce short-term volatility impact
Strategy Three | Reverse position upon losing the watershed
$UBALIBA@EP2608A.P (26410.HK)$ | Strike price 132.78 | Actual leverage 4.9 times | Close to current price below, suitable for quickly capturing weakening momentum after breakdown
$UBALIBA@EP2607C.P (26011.HK)$ | Strike price 127.28 | Actual leverage 6.5 times | Higher leverage, suitable for amplifying returns during accelerated declines
$UBALIBA@EP2609A.P (24593.HK)$ | Strike price 149.90 | Actual leverage 3.3 times | Lower leverage, suitable for defensive positioning expecting weakness but not a sharp drop
Reply to some investors' views:
@@Ian Rush: The intraday high reached yesterday reflects that short-term funds are still pushing up prices, but after breaking through the upper band, watch out for fluctuations at higher levels.
@@有內涵的勞倫特: A too rapid rise will indeed increase volatility; at this stage, the most important thing is not how fast it rises, but whether it can stabilize above 141.23.
@七玖玖Trading volume has picked up, but to sustain an upward test towards 150 to 160, more stable trading support will still be needed going forward.
Feel free to share your insights in the comment section. For more market analysis, please continue following ‘Hong Kong Stock Warrants Jenny’ for daily updates!
Reminder: This article does not constitute any investment advice.
This article is for reference only and does not constitute any investment advice. Market data, opinions, and analyses contained herein may change at any time without prior notice. We are not responsible for any loss or damage caused by reliance on the information in this article. Technical analysis only shows whether certain technical conditions are met, and asset performance should be comprehensively evaluated in conjunction with other information. Trading decisions should not be made solely based on this article. Please note that past performance is not indicative of future results. $Hang Seng Index (800000.HK)$$Hang Seng TECH Index (800700.HK)$
#HKStocks #RealTimeAnalysis #WarrantPick #WarrantGuide #DerivativesHedging #HKWarrantsJenny #Alibaba #09988 #BlueChipStocks #TechnicalAnalysis
Risk Disclaimer: The above content only represents the author's view. It does not represent any position or investment advice of Futu. Futu makes no representation or warranty.Read more

Comments (2)
to post a comment
3