
Hong Kong stocks pull back—how will they perform in the second half of the year?
Tencent falls below the 10-day line again; 477.36 becomes a key watershed
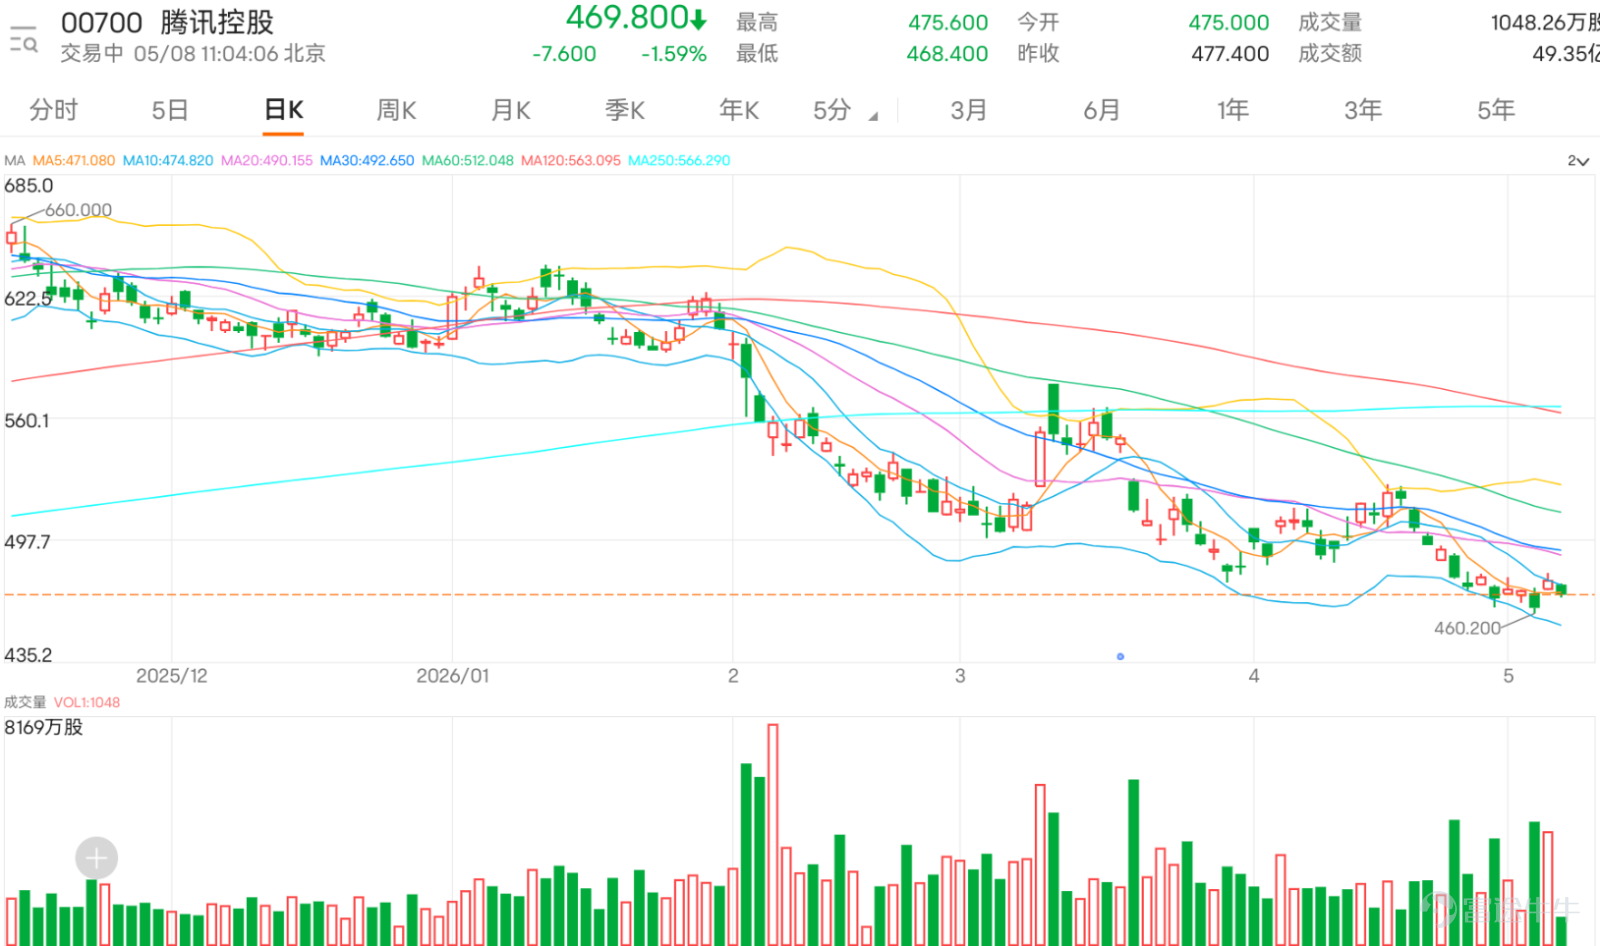
$TENCENT (00700.HK)$ Current price at 469.8, the stock has once again fallen below the 10-day line at 474.900, indicating a weakening short-term trend. To confirm improvement in the short-term structure, it needs to stabilize above 477.360 and further challenge the resistance zone between 492.090 and 493.603.
Investor comments are clearly focused around the 480 level, with strong psychological attention on this price point. Some investors are asking if 480 will act as resistance, while others believe there is pressure at 480, or even hope for a breakout above 480 tomorrow, targeting 490 or 495. This reflects a shift in market sentiment from pessimism at lower levels to chasing a short-term rebound, though confidence is still incomplete as Tencent remains some distance from a true strengthening position.
On the bullish side, some investors have set targets of 520, 550, or even 700, while others think today's trend is strong and suggest buying now. Such comments reflect capital starting to anticipate a continuation of Tencent’s rebound. However, doubts remain in the market: Is it normal for the stock price to keep rising without a pullback? Some mention entering at lower levels, showing that many investors still worry about an overextended rebound or insufficient risk-reward ratio at current prices.
Technically, 477.360 is the first short-term watershed. If Tencent can stabilize above this level, it would be a positive signal, but sustained stability is needed for conviction. The more important resistance remains between 492.090 and 493.603. A breakout above this range would indicate that the short-term structure has shifted from weak recovery to a clearer continuation of a rebound. If unable to break through, the stock will likely remain in a weak, volatile pattern.
Trading volume slightly increased yesterday, supporting the rise in price, reflecting some capital participation in the rebound. However, there was no significant surge in volume, indicating buying momentum remains moderate. The Relative Strength Index (RSI) is approximately 47.227, with momentum yet to return to the bullish zone. Therefore, the current risk-reward ratio is only neutral to low, making it unsuitable for aggressive long positions.
Overall, Tencent's short-term focus is on stabilizing above 477.360 and attempting to break through the resistance between 492.090 and 493.603. If it fails to hold, the trend could weaken again, raising the risk of a retest of support between 460.200 and 456.501.

Key strategy: 477.360 serves as the watershed. Holding above this level offers potential for a rebound towards testing 492.090 to 493.603; if it breaks below 460.200, weakness resumes, and a further decline may follow.
Regarding call warrants, you can consider trustworthy options $CITENCT@EC2611B.C (28638.HK)$ Its exercise price is 555 yuan, offering approximately 7.2 times leverage. The key feature of this warrant is that its leverage is the highest among similar products, while its premium and implied volatility are the lowest. This means investors can efficiently participate in the potential upside of the underlying stock with lower cost and minimal impact from volatility.
For put warrants, there are two products available for selection. $UBTENCT@EP2608B.P (26702.HK)$ The exercise price is 428.68 yuan, providing approximately 9.1 times leverage. Its implied volatility is the lowest among similar products, and its leverage is relatively high, making it suitable for investors who are bearish on the market outlook and prioritize stable volatility. Another option is $JPTENCT@EP2608B.P (27020.HK)$ with the same exercise price of 428.68 yuan and leverage of around 9 times. This warrant offers an ideal balance of leverage and implied volatility, providing investors with a balanced tool for bearish deployment.
For bull contracts, $BI#TENCTRC2612T.C (68543.HK)$ The knock-in price is 450 yuan, offering approximately 13.8 times effective leverage. Its standout feature is that its effective leverage is the highest among recommended products, and its premium is low, effectively amplifying bullish returns. $JP#TENCTRC2611F.C (65222.HK)$ The knock-in price is 455 yuan, with effective leverage of approximately 18.7 times. This warrant has the lowest premium among similar products, along with very high effective leverage, making it suitable for bullish investors seeking extremely low premiums and high leverage effects.
As for bear certificates, $UB#TENCTRP28122.P (64277.HK)$ The knock-in price is 500 yuan, offering approximately 20.3 times effective leverage. Its relatively low premium reduces tracking error with the underlying stock price. $JP#TENCTRP2811J.P (62157.HK)$ The knock-in price is 508 yuan, with effective leverage of approximately 15.4 times. This warrant combines high effective leverage and low premium, allowing bearish investors to more effectively capture potential downside.

@53654285The 480 level is indeed a short-term psychological threshold, but the true technical resistance lies between 492.090 and 493.603.
@NaNamLevels at 481, 495, and 520 should be analyzed in stages: first stabilize above 477.360, then break through 492.090 to 493.603, before considering higher targets.
@28610760: The long-term target of 700 remains, but a short-term breakthrough above 493.603 is necessary to establish a stronger upward momentum.
@Jelly_479: A larger rebound space is required for the cost at 550; the short-term focus is on whether it can break through 493.603.
Feel free to share your insights in the comment section. For more market analysis, please continue following ‘Hong Kong Stock Warrants Jenny’ for daily updates!
Reminder: This article does not constitute any investment advice.
This article is for reference only and does not constitute any investment advice. Market data, opinions, and analyses contained herein may change at any time without prior notice. We are not responsible for any loss or damage caused by reliance on the information in this article. Technical analysis only shows whether certain technical conditions are met, and asset performance should be comprehensively evaluated in conjunction with other information. Trading decisions should not be made solely based on this article. Please note that past performance is not indicative of future results. $Hang Seng Index (800000.HK)$$Hang Seng TECH Index (800700.HK)$
#HKStocks #Real-TimeAnalysis #WarrantSelection #WarrantGuide #DerivativesHedging #HKWarrantsJenny #Tencent #00700 #Blue-ChipStocks #TechnicalAnalysis
Risk Disclaimer: The above content only represents the author's view. It does not represent any position or investment advice of Futu. Futu makes no representation or warranty.Read more

Comments (5)
to post a comment
2