
Hong Kong stocks pull back—how will they perform in the second half of the year?
CNOOC receives a buy signal against the trend; short-term defense focuses on 25.3 yuan
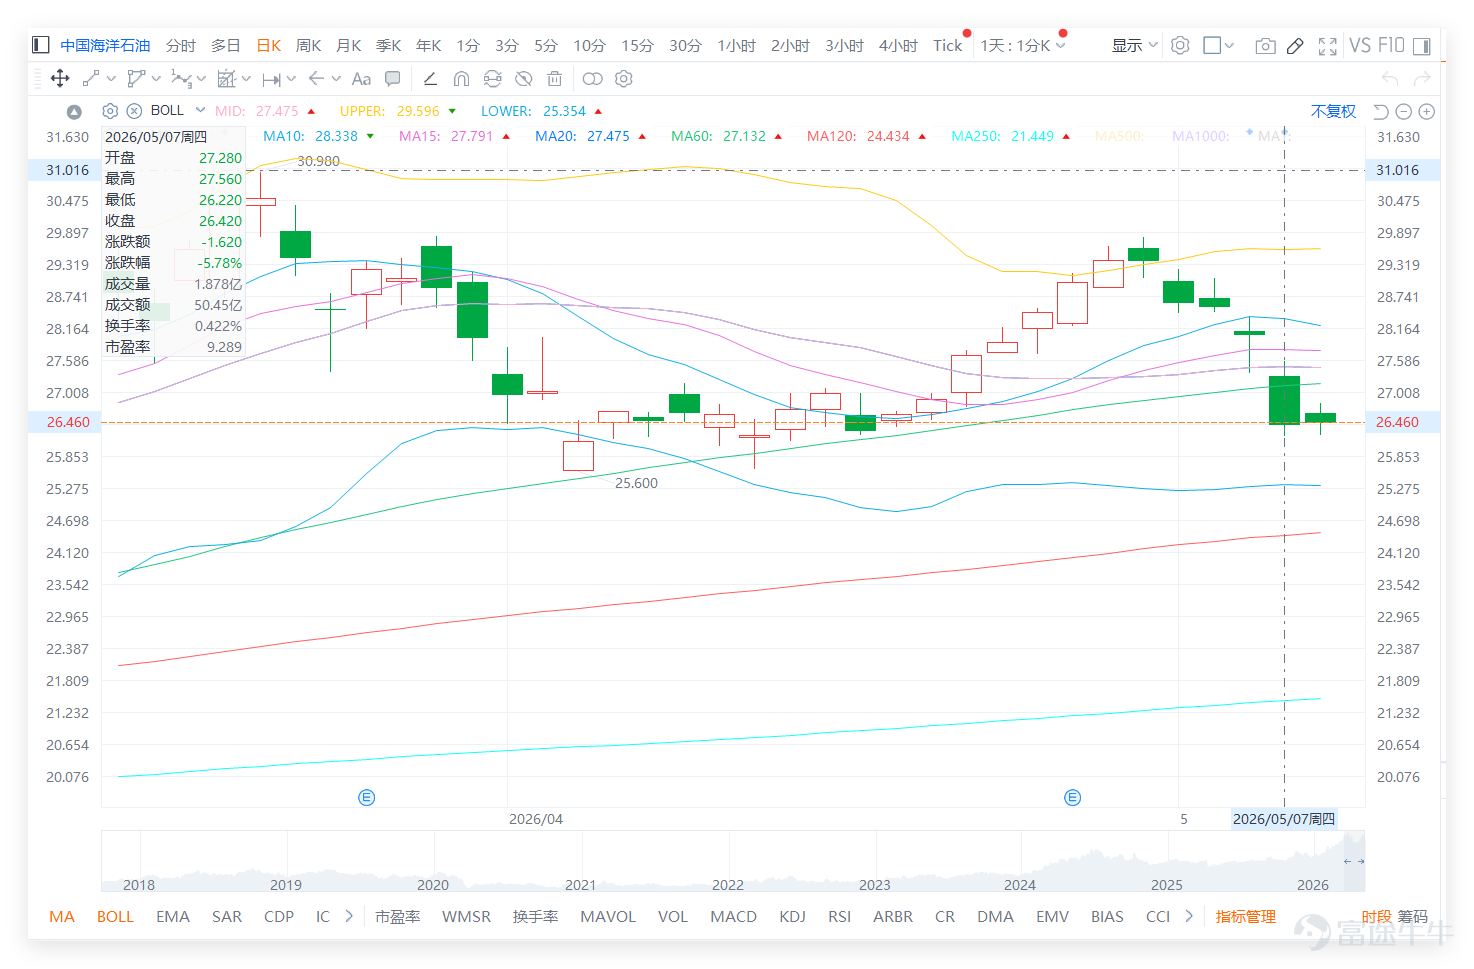
The closing price the previous day (7th) was 26.420, with the stock price breaking below the 10-day, 20-day, and 30-day moving averages, indicating a clear weakening in the short-term structure. Although the previous day's closing price remained above the lower Bollinger Band at 25.354, the pressure from a shift from consolidation at highs to a pullback has increased, with no clear signs of a stop to the decline yet.

CNOOC (00883) technical signal is 'Buy,' compared to peers in the energy sector, $KUNLUN ENERGY (00135.HK)$ And, $ENN ENERGY (02688.HK)$ the technical signal is also 'Buy,' with the RSI in the low range of 38-43, showing that both the oil and gas distribution and upstream exploration sectors are facing short-term adjustment pressures; $PETROCHINA (00857.HK)$ the technical signal is 'Neutral,' with relatively stable trends. In comparison, $XINTE ENERGY (01799.HK)$ the technical signal is 'Sell' with an RSI as high as 62, presenting a clear divergence. This means that CNOOC’s current 'Buy' signal is essentially maintained by fundamental support, representing 'relative strength' in an environment where the overall technical picture of the energy sector is weak, with widespread correction pressures. Whether it can hold above 25.354 will determine if it stabilizes ahead during the sector's adjustment or follows peers for further downside.

Investor comments reflect that market sentiment has shifted from divergence to weakness. Some investors view every sharp decline as an opportunity to increase positions, while others see low valuations as a reason to hold, indicating that there are still voices optimistic about the medium to long term. However, more comments focus on panic and pullback pressures, such as 'five consecutive declines are alarming,' concerns about whether it will drop to 25, and suspicions of capital outflows, showing weakened short-term confidence.
Common market concerns mainly focus on three points:
First, whether it is worth buying back at the current level after the decline;
Second, whether it can rebound back to 28;
Third, whether the level near 25 will be breached.
Technically speaking, 27.475 is the short-term watershed; unless the price moves back above this level, any upward movement should only be considered a weak rebound. Meanwhile, 25.354 remains the most critical support level, and a break below it could lead to further weakness.
Trading volume has significantly increased, coinciding with the drop in stock price, reflecting growing selling pressure and weaker short-term support. The Relative Strength Index (RSI) is approximately 24.659, which is close to the oversold zone, but being oversold does not equate to an immediate rebound. The stock would need to regain the 27.475 level to confirm stabilization.
Overall, CNOOC currently offers a low risk-reward ratio. The concepts of low valuation and high dividends can support mid-to-long-term confidence, but the short-term technical structure has weakened. It is not advisable to prematurely assume a bottom has been reached; instead, observe whether 25.354 can hold and whether 27.475 can be reclaimed.
Reply to some investors' views:
@炒股又炒飯: After a major drop, opportunities to add positions can be considered, but for now, it’s essential to first confirm that 25.354 holds steady.
@美股緬因貓: Five consecutive declines indicate significant short-term selling pressure, and before re-entering above 27.475, it’s too early to predict a bottom.
Based on the above analysis, the strategies for deployment can be divided into the following main approaches:


For more market analysis, stay tuned to Jenny's daily updates on 'Hong Kong Stock Warrants'!
Reminder: This article does not constitute any investment advice.
This article is for reference only and does not constitute any investment advice. Market data, opinions, and analysis contained herein may change at any time without prior notice. We are not responsible for any loss or damage caused by reliance on the information in this article. Technical analysis only shows whether certain technical conditions are met; asset performance should be comprehensively evaluated using other sources of information, and trading decisions should not be made solely based on this article. Please note that past performance is not indicative of future results.
#HKStocks #CNOOC #Real-TimeAnalysis #WarrantPick #WarrantGuide #DerivativesHedging #HKWarrantsJenny #Blue-ChipStocks #TechnicalAnalysis
Risk Disclaimer: The above content only represents the author's view. It does not represent any position or investment advice of Futu. Futu makes no representation or warranty.Read more

Comments
to post a comment
5