
Hong Kong stocks pull back—how will they perform in the second half of the year?
Alibaba back above 140, is this the precursor to a breakout or a high-level bull trap?
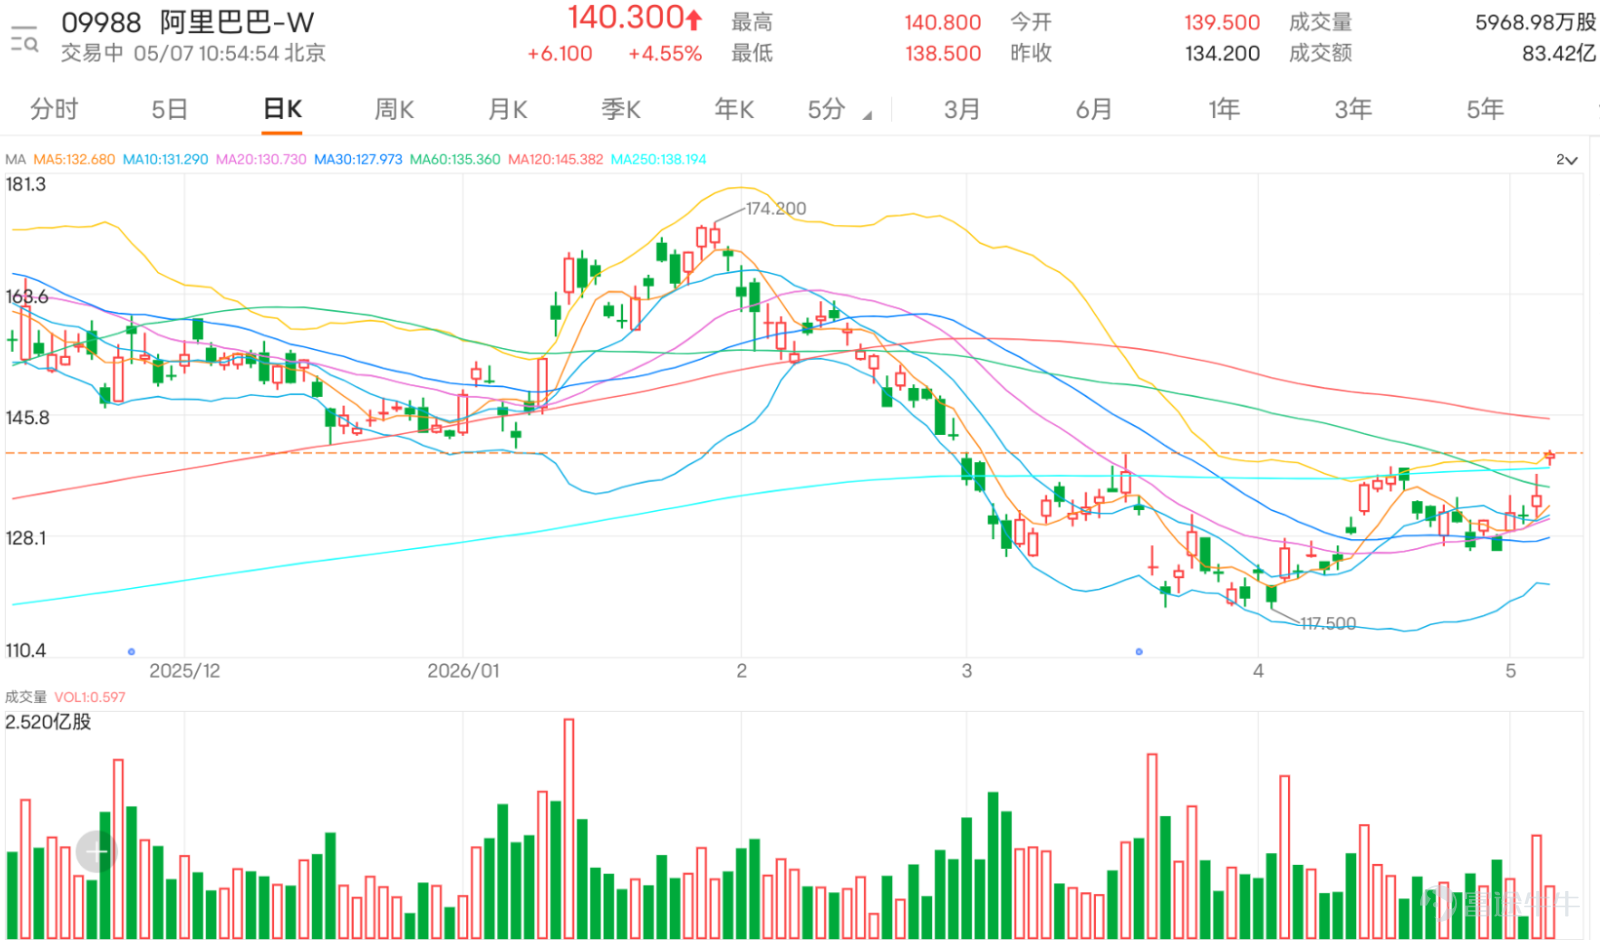
$BABA-W (09988.HK)$ The current price is 140.3, with the most immediate resistance above at 138.768. A breakout above 138.768 with sufficient trading volume could attract short-term capital inflows, driving the stock price to challenge 140, or even 142.3. This level is close to the 138-140 range mentioned by many investors, so market sentiment and technical resistance are highly overlapping. This situation has two sides: the advantage is that the market target is clear; the downside is that when too many people focus on the same target, profit-taking and short-term selling pressure can easily emerge before a breakout, making the range between 135 and 139 a volatile zone.
Alibaba's short-term structure has clearly improved compared to earlier. The share price has regained the middle axis of the Bollinger Band at 130.040, while also staying above the 10-day line at 130.410 and the 30-day line at 127.420. This indicates that the short-term rebound is no longer just a weak pullback but is beginning to form a more stable upward structure. At this stage, the most important level is not 135 or 140, but the watershed at 130.040. As long as the share price stays above 130.040, the short-term outlook remains biased towards a strong rebound. Conversely, if it breaks below 130.040, market confidence in Alibaba's rebound will be pressured again, and levels like 127.420 and 121.312 may re-emerge as downside risks.
Regarding trading volume, the latest turnover has significantly increased, coinciding with the rise in stock price, which is a positive signal. It reflects that this round of rebound isn't purely a speculative rise without substantial trading volume, indicating that short-term support has indeed improved. However, a rising volume only shows that funds are willing to participate at this stage—it doesn't necessarily mean the stock has officially entered a one-sided uptrend. The true confirmation of strength still depends on breaking through and stabilizing above 138.768; otherwise, this should be viewed as a consolidation after a rebound, rather than an already confirmed breakout.
The Relative Strength Index (RSI) is around 61.320, which is moderately strong but not overly overheated. This figure itself supports further testing of resistance levels, but it also reminds us not to chase prices excessively in the short term. Since the stock has already rebounded from near 130 to above 134, and the market has begun focusing on the 138-140 range, the short-term risk-reward ratio is less attractive than when accumulating at lower levels. A more reasonable strategy at this stage would not be emotionally chasing the stock but distinguishing between two trading scenarios: First, if the stock pulls back but holds steady between 130.040 and 130.410, it would still represent a strong consolidation, offering opportunities to buy on dips. Second, only if the stock breaks through 138.768 would it truly open up room for testing levels above 140.
Regarding investor comments, bullish sentiment has clearly increased, with many directly targeting 140. For example, comments such as 'going to 140', 'rise to 140', and 'Friday might reach 138-140' are aligned with the technical resistance zone and are not completely baseless. Alibaba does indeed have the potential to challenge 138.768, as long as it doesn't fall below 130.040, the rebound structure remains intact. However, the issue is that many bullish comments assume 140 is a natural target, ignoring that 138.768 is a major resistance level. In other words, being bullish is fine, but a breakout should not be considered inevitable.
A comment from @PWK is particularly noteworthy, as it mentions support at 130, as well as targets at 135 and 138-140. This perspective is closer to a trading framework than simply calling for a rise because it includes both support and target levels. If 135 can indeed hold, combined with sustained trading volume, there's a higher chance of challenging the 138.768-140 range.
Bearish comments mainly focus on negative news, disappointment about the future, concerns about a top, and weak sentiment. These views reflect that the market still lacks long-term confidence in Alibaba. Even though the stock price rebounds, many investors suspect it might just be another bull trap or short-term pump. This skepticism has its background, as Alibaba’s past rebounds often failed to sustain, creating a 'fear of a top after every rise' mentality among investors. However, from a technical perspective, it is still premature to conclude a top has formed, as the price hasn’t broken below 130.040, and there is supportive trading volume; structurally, no clear sign of weakness has emerged.
Observation and sentiment-based comments reflect retail investors’ most genuine contradictions. On one hand, some ask, 'Is 135 a good entry?' while others wonder, 'Shouldn’t we exit yet?' This is the typical psychological state when the price faces resistance. Investors are afraid to chase highs, but they’re also afraid of selling too early and missing potential gains. For short-term trading, this position is the most dangerous for decisions driven purely by emotion. The area around 135 isn’t the most comfortable entry point since the upside to 138.768 isn’t very large. However, if the price falls back near 130, the pullback would be significant. Therefore, for those without a position, chasing at 135 offers relatively low reward-to-risk; for those already holding, 130.040 should serve as an important defensive line, with 138.768 as the first profit-taking target.
Overall, Alibaba is neither currently a weak stock nor a strong stock that has fully broken out. It is in a phase where the rebound is improving, trading volume is supportive, sentiment is heating up, but it remains constrained by overhead resistance. At this stage, the most reasonable assessment is: as long as 130.040 holds, there are still conditions for a short-term push to test 140 or even 142.3. Breaking above 138.768 would make 140 a realistic target. However, if it breaks below 130.040, the rebound structure would be damaged, and the market would revert to the risk framework centered around 127.420 or even 121.312.
For short-term trading, the key focus for Alibaba isn’t guessing whether it will reach 140, but waiting for price confirmation. 130.040 is the defensive line, 138.768 is the critical level, and 135 is merely an intermediate position. The most common mistake the market makes now is rushing to chase highs due to seeing a rebound, or being overly bearish because of past disappointments. A truly steady approach is to follow the trend but not blindly, maintain a bullish bias with stop-losses in place, and wait for a confirmed breakout rather than pre-emptively assuming one.

Key deployment: Holding above 130.040 can extend the rebound and test 138.768; a breakout can be followed for momentum. Falling below 130.040 indicates weakness, watch for a retest of 127.420 and 121.312.
Strategy One | Follow the Breakout (Aggressive Bias)
$UBALIBA@EC2607D.C (26262.HK)$ | Strike price 165.10 | 10.8x leverage | Close to current price on the upside; once breaking through 138.768, gains may quickly accelerate, suitable for immediate follow-up after a breakout.
$UBALIBA@EC2608D.C (26007.HK)$ | Strike price 168.98 | 8.8x leverage | Moderate and stable leverage, suitable for holding after confirming a breakout. $UBALIBA@EC2609C.C (26839.HK)$ | Strike price 183.98 | 6.5x leverage | Further out-of-the-money, with relatively stable volatility, suitable for medium- to short-term strategies anticipating an extended upward trend.
Strategy Two | Buying at the lower end of the range (buying on pullbacks)
$UBALIBA@EC2609B.C (26544.HK)$ | Strike price 145.98 | 5.8x leverage | Close to current price on the downside; a pullback near the support zone can provide opportunities for low-risk accumulation. $UBALIBA@EC2612B.C (27776.HK)$ | Strike price 145.10 | 4.3x leverage | Lower leverage, suitable for conservative capital to buy during pullbacks. $HSALIBA@EC2609D.C (27430.HK)$ | Strike price 150.98 | 6.3x leverage | Positioned between the two, suitable for entering after confirming support near 130.
Strategy Three | Breakdown and Weakness (Defensive / Momentum Short Selling)
$UBALIBA@EP2607A.P (20367.HK)$ | Strike price 130.00 | 7.1x leverage | Close to the watershed level; if it falls below 130, downside momentum could quickly manifest. $CIALIBA@EP2607A.P (24526.HK)$ | Strike price 127.38 | 6.4x leverage | Corresponds to the next support level, suitable for extending bearish wave deployments. $BPALIBA@EP2608A.P (24449.HK)$ | Strike Price 122.88 | 6.4x | Further target, suitable for swing trading expecting a continued downtrend
Reminder: This article does not constitute any investment advice.
This article is for reference only and does not constitute any investment advice. Market data, opinions, and analysis contained herein may change at any time without prior notice. We are not responsible for any loss or damage caused by reliance on the information in this article. Technical analysis only shows whether certain technical conditions are met; asset performance should be comprehensively evaluated using other sources of information, and trading decisions should not be made solely based on this article. Please note that past performance is not indicative of future results.
#HKStocks #RealTimeAnalysis #WarrantPick #WarrantGuide #DerivativesHedging #HKWarrantsJenny #HangSengIndex #Alibaba #BlueChipStocks #TechnicalAnalysis$Hang Seng Index (800000.HK)$$Hang Seng TECH Index (800700.HK)$
Risk Disclaimer: The above content only represents the author's view. It does not represent any position or investment advice of Futu. Futu makes no representation or warranty.Read more

Comments (5)
to post a comment
2