
Hong Kong stocks pull back—how will they perform in the second half of the year?
Baidu strongly breaks through key resistance but receives a 'sell' rating divergence, short-term pullback pressure emerges
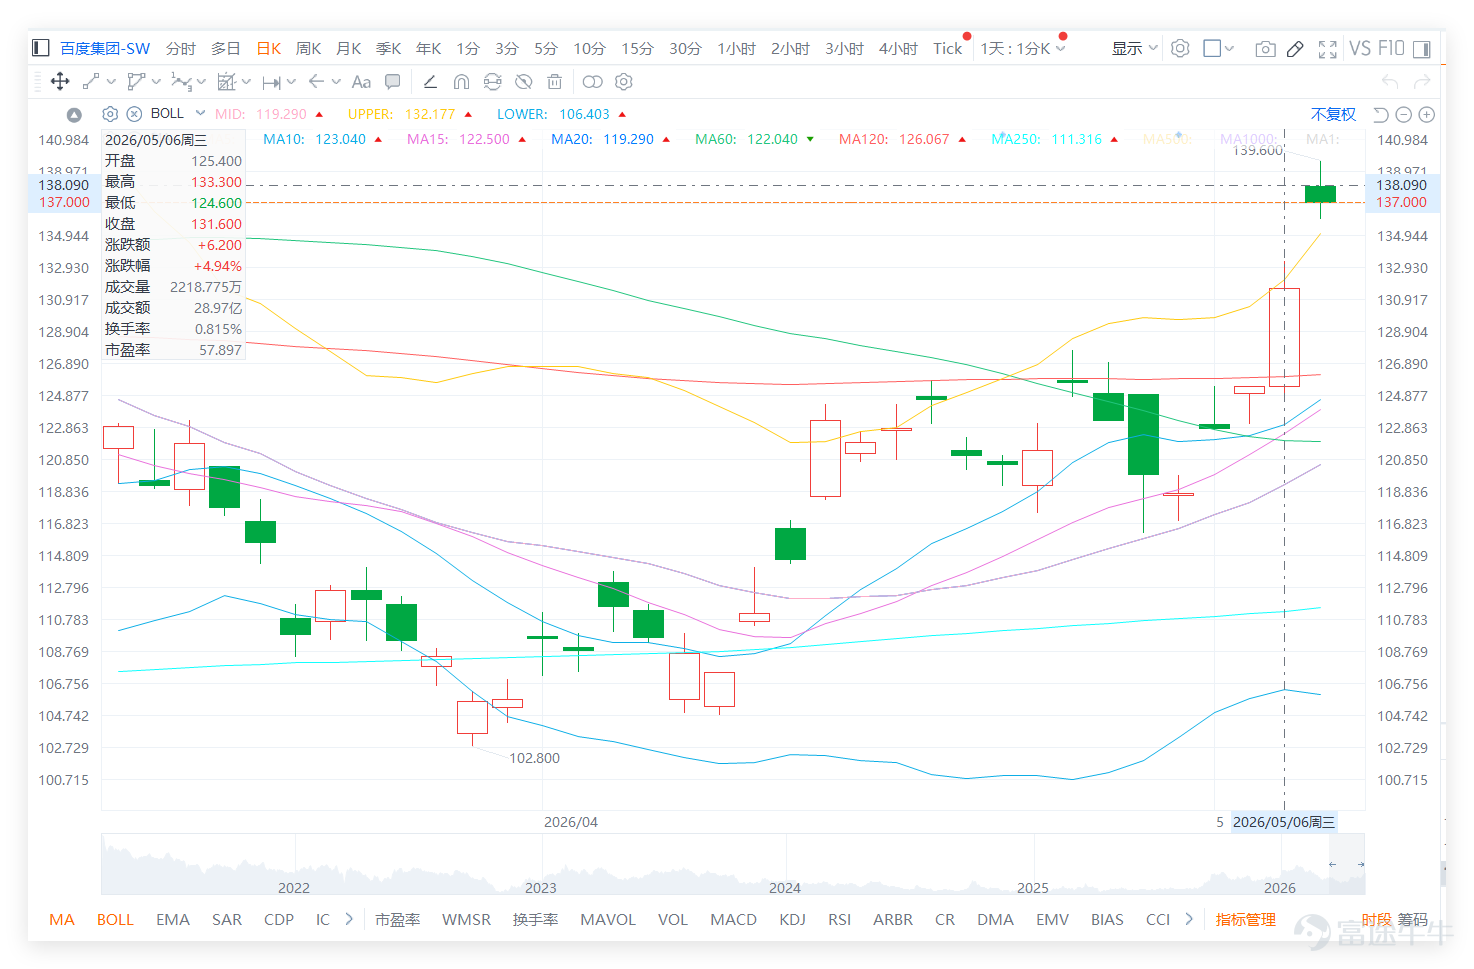
The closing price on the previous day (6th) was 131.600, and the short-term trend has clearly strengthened. The stock price is above the Bollinger Bands middle line at 119.290, the 10-day line at 123.040, and the 30-day line at 116.110, indicating that this rebound is not just a weak bounce, but has re-established a short-term upward structure. Especially with the significant rise in volume on the latest trading day, reflecting a clear improvement in capital inflow, the market's short-term pricing of Baidu is being readjusted upwards.

Looking at the tech sector, the market shows obvious technical divergence. Despite the strong stock price, Baidu’s technical indicators signal a 'sell,' with an RSI of 59, which is relatively high. In contrast, $TENCENT (00700.HK)$ And, $MEITUAN-W (03690.HK)$ the technical signal is 'buy,' and the RSI (34-49) is low, indicating potential demand for an oversold rebound.

This indicates that Baidu's strong rebound is occurring in an environment where there is divergence within the sector’s technical ratings, and its own systemic rating has yet to strengthen in sync. The 'sell' signal contradicts its current trend, and technically, the sustainability of its rebound has not been confirmed. This also means that whether it can effectively break through the resistance zone at 132.177 will depend not only on its own strong momentum but also on whether peers (especially stocks with buy ratings) can provide sector-wide support to reverse its bearish technical rating.
However, the most important judgment at this stage is not whether Baidu has a story, but that the stock price is already close to the upper Bollinger Band at 132.177. The current price of 131.600 is very near to 132.177, indicating that the stock has entered a short-term resistance zone. If it can break through and stabilize above 132.177, this rebound could upgrade from a strong recovery to a breakout, with the next major technical target being 161.200. Conversely, if the stock encounters resistance around 132.177, caution is needed against profit-taking; initial support is seen at 123.040, and a key watershed level lies at 119.290.
The risk-reward ratio here needs to be analyzed separately. From a directional perspective, Baidu is indeed showing strength; however, in terms of position, the risk-reward ratio for entering now is less favorable compared to lower levels. The Relative Strength Index (RSI) is approximately 76.156, signaling strong momentum but approaching overbought levels. This reflects that capital inflows are chasing the stock, while also implying increased short-term volatility. For existing holders, this is a positive trend signal; for those without positions, entering now carries the risk of short-term pullbacks.
In investor comments, bullish sentiment is clearly driven by fundamental stories, with focus on Kunlun chips, large cloud business deals, and post-earnings upside potential targeting 200. These views reflect that the market is starting to reimagine Baidu's valuation space, particularly amplifying concepts like artificial intelligence, chips, and cloud services. The issue is that targets like 200 are distant sentiment-driven goals and should not be directly applied to short-term trading. For Baidu to reach 150 or even 200, it must first complete a breakout above 132.177, followed by sustained trading volume support before challenging higher levels. If it fails to stabilize above 132.177, prematurely calling for 200 will only make short-term trading overly emotional.
Among these, comments like 'Head and shoulders bottom breakout, targeting above 150' deserve attention as they include technical pattern analysis. Based on existing technical data, Baidu is indeed in a phase of clear improvement; breaking through 132.177 would open up further upside, making levels above 150 worth discussing. However, confirmation of the breakout is still required at this stage, rather than assuming it has already been completed.
Bearish comments mainly reflect two types of sentiment. The first is the fear of a sharp pullback after a rapid rise, which is not entirely unreasonable as the relative strength index is already overheated and stock prices are close to the upper Bollinger Band, meaning short-term profit-taking risks objectively exist. The second is skepticism about Baidu's long-term usage rate and fundamental outlook, for example, 'Fewer people use Baidu these days.' Such views indicate that market trust in Baidu has not fully recovered, and even with a sharp rise in stock price, some investors remain unconvinced that this revaluation can be sustained.
However, it’s important to note that being bearish doesn't mean one can immediately short the stock. At this stage, Baidu’s price structure remains clearly strong, and trading volume supports the upward trend. If one judges a pullback simply because of a significant rise, the risk could be quite high. A true weakening signal isn’t just saying 'it's running out of steam,' but rather when the stock price fails to break through 132.177 and then falls back, dropping below 123.040, or even breaking down below 119.290. Until these signals appear, shorting remains a contrarian move.
Onlooker comments better reflect the market's true state. 'Is there any good news today?' shows that many investors were surprised by the sudden surge; 'This stock is behaving well today' reflects lingering concerns about Baidu’s historical instability, causing the market to still be cautious about its rally. 'It rises less when others rise, and falls more when others fall' suggests investors are still haunted by Baidu’s past performance. These sentiments are not uncommon and precisely show that the market does not yet fully believe in Baidu’s current rebound.
Overall, Baidu is not currently a weak stock, but rather one that has strongly rebounded and is now facing a breakout test. The most ideal scenario would be if the price breaks above 132.177 and stabilizes, without falling back below 123.040 during pullbacks, confirming the breakout. The situation requiring the most caution would be a rapid intraday spike that fails to stabilize, followed by a quick retreat to around 123, forming a profit-taking pattern at higher levels.
The short-term strategy is very clear. Investors who already hold the stock can continue observing 132.177 as the breakout level. If it breaks through and stabilizes, they may look for higher targets. If it encounters significant resistance near 132, they should consider locking in profits incrementally. Those without positions should not chase the stock aggressively just because the market is calling for targets of 150 or 200. A more reasonable approach would be to wait for a stabilized breakout or a pullback to around 123.040 before making decisions. If it breaks below 119.290, the rebound structure will be significantly damaged, necessitating a reassessment of risk.
The core contradiction in Baidu’s current movement is that the narrative has suddenly strengthened, but the price has already risen to near-term resistance levels. Being bullish isn’t wrong, but lacking risk awareness at resistance levels is a mistake. Similarly, being bearish isn’t entirely baseless, but prematurely counter-trending without seeing signs of weakness is also a misstep. The real trading demarcation lies in whether the price can stabilize above 132.177, not what target prices the market is currently calling for.
Reply to some investors' views:
@大大大升: A target of 200 after earnings reflects sentiment, but should not be directly used as a trading basis at this stage; first, check if the breakout above 132.177 is valid.
@忍忍忍忍忍呀: Judging by the pattern, a breakout could indeed open up upside potential, but it is necessary to confirm stability above 132.177 first—only then does discussion above 150 have a foundation.
Based on the above analysis, the strategies for deployment can be divided into the following main approaches:
Deployment Focus: Breaking through and stabilizing above 132.177 would confirm a strengthening trend and test levels towards 161.200; failure to break through calls for caution regarding pullbacks, with a drop below 123.040 signaling further tests down to 119.290.
Strategy One | Breakout Momentum (Aggressive Approach)
$UBBAIDU@EC2607B.C (25832.HK)$ | Strike Price 160.09 | 7.6x Leverage | Close to the breakout area; if stabilized above 132, rapid gains are possible, suitable for immediate entry upon breakout.
$UBBAIDU@EC2610A.C (27686.HK)$ | Strike Price 151.21 | 4.7x Leverage | Moderate leverage, suitable for continued follow-up once strength is confirmed.
$UBBAIDU@EC2609A.C (28166.HK)$ | Strike Price 140.00 | 4.8x Leverage | Closer-priced product with stable volatility, suitable for extended deployment post-breakout.
Strategy Two | Pullback Accumulation (Low-Absorption Deployment)
$BIBAIDU@EC2609A.C (28265.HK)$ | Strike Price 140.00 | 4.9x Leverage | Near current price levels, suitable for accumulation around a pullback to 123.
$HUBAIDU@EC2611A.C (26819.HK)$ | Strike Price 145.00 | 4.4x Leverage | Lower leverage, suitable for conservative funds waiting for pullback to accumulate
$MSBAIDU@EC2610A.C (28328.HK)$ | Strike Price 153.99 | 4.6x Leverage | Mid-range deployment, suitable for expecting a rebound after a pullback
Strategy Three | Resistance at Highs / Weakening (Defensive)
$UBBAIDU@EP2607A.P (20739.HK)$ | Strike Price 113.78 | 6.1x Leverage | If unable to break through 132 and weakens, can capture the pullback phase
$CIBAIDU@EP2607A.P (20548.HK)$ | Strike Price 113.88 | 6.0x Leverage | Corresponding to lower support zone, suitable for extending downward momentum positioning
$UBBAIDU@EP2607B.P (24276.HK)$ | Strike Price 131.70 | 4.8x Leverage | Close to current price, suitable for immediate reaction to weakening at highs
For more market analysis, stay tuned to Jenny's daily updates on 'Hong Kong Stock Warrants'!
Reminder: This article does not constitute any investment advice.
This article is for reference only and does not constitute any investment advice. Market data, opinions, and analysis contained herein may change at any time without prior notice. We are not responsible for any loss or damage caused by reliance on the information in this article. Technical analysis only shows whether certain technical conditions are met; asset performance should be comprehensively evaluated using other sources of information, and trading decisions should not be made solely based on this article. Please note that past performance is not indicative of future results.
#HKStocks #Baidu #Real-TimeAnalysis #WarrantSelection #WarrantGuide #DerivativesHedging #HKWarrantsJenny #Blue-ChipStocks #TechnicalAnalysis
Risk Disclaimer: The above content only represents the author's view. It does not represent any position or investment advice of Futu. Futu makes no representation or warranty.Read more
Comment (1)
to post a comment