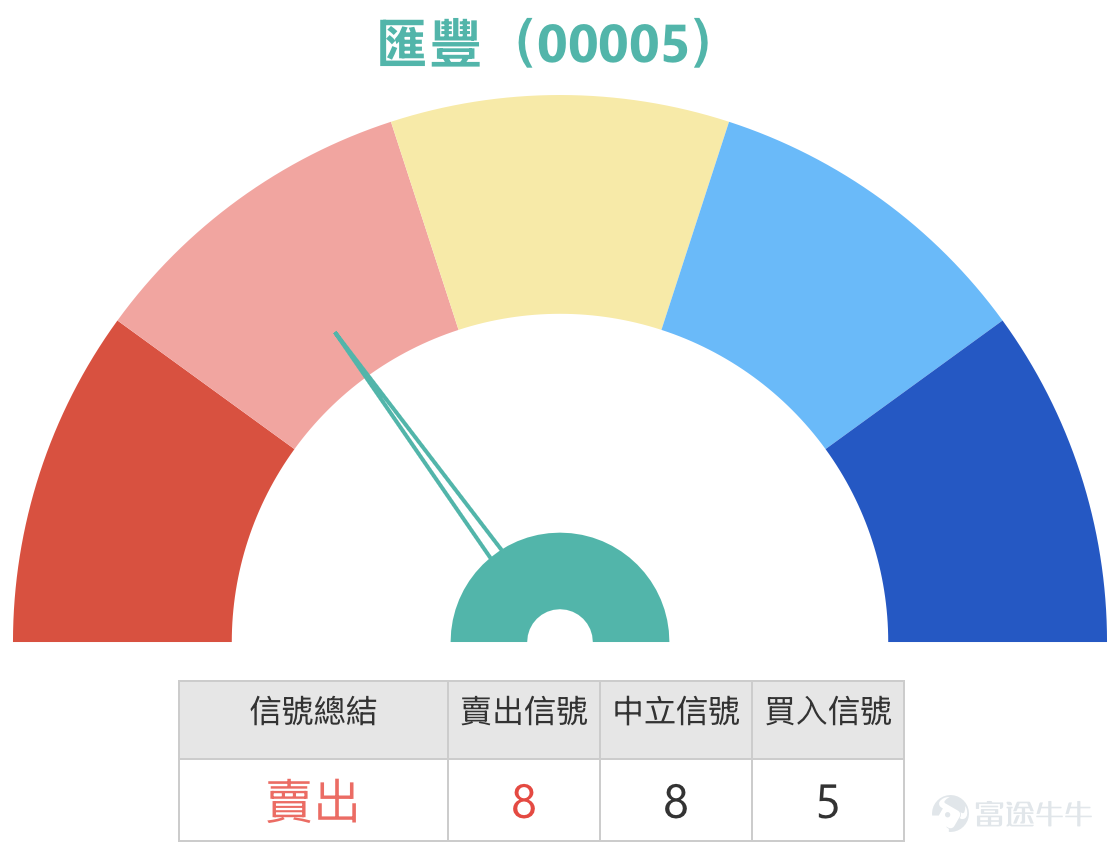

HSBC retraced from its high, fluctuating between $134.25 and $140.23
HSBC Holdings (00005) closed at $136.000 yesterday (5th), down 5.16%. The drop significantly impacted investor sentiment as HSBC has long been regarded by the market as a relatively stable, high-dividend blue-chip stock. Many investors held it with the mindset of dividend collection, long-term holding, and low volatility. However, the single-day plunge of over $7 quickly shifted the market’s mentality from 'dividend stock' to panic about whether the stock had peaked or if there were hidden concerns.
From the comments, market sentiment can be divided into several distinct reactions.
One type is the bottom-fishing group. Some believe the stock has fallen too much and should rebound soon; others say it will recover tomorrow and rise back to 140; some view this decline as a buying opportunity, considering HSBC a long-term dividend stock, and think the drop provides a chance to accumulate gradually. These investors’ rationale is that HSBC is not a penny stock, and its fundamentals still show profitability and dividend support, so a sharp one-day fall doesn’t mean the company’s quality has completely deteriorated.
However, the biggest risk with this perspective is equating 'a large drop' with 'a sure rebound' too quickly. HSBC’s current price of 136.000 is already below the middle line of the Bollinger Bands at 140.230, the 5-day moving average at 141.020, and the 10-day moving average at 141.020, indicating a clearly weakened short-term structure. Even if there is a technical rebound, it will be crucial to see if it can hold above 134.997 and 134.249. If these two levels fail to hold, bargain-hunting funds could easily turn into catching a falling knife.
Another type is panic-driven. There are many comments suggesting only considering buying below 120, 128, 130, or even below 100, with some describing it as 'bottom-fishing turning into a wipeout,' 'closing at the day's lowest point,' 'hidden risks,' and 'not catching a falling knife.' These comments reflect that the market’s understanding of HSBC Holdings’ decline is no longer seen as a normal pullback, but rather starting to question whether there are more underlying risks behind its earnings.
This panic is not completely unfounded. The latest trading volume has significantly increased, coupled with a sharp pullback in stock price, indicating that selling pressure is real and not just minor profit-taking. When high-dividend blue-chip stocks experience heavy selling and a sharp drop, the market naturally reassesses two things: First, whether the earlier rise was excessive; second, whether earnings or provisions have led the market to lower its valuation.
There is also a divergence in fundamental analysis among the comments. Some believe the earnings results are not bad, with Hong Kong operations remaining stable, dividends unchanged, and long-term prospects still favorable. However, others highlight credit loss provisions, increased reserves, lack of buybacks, and UK-related risks, making it difficult for the market to regain confidence in the short term. This kind of discussion is the most valuable because it shows the market isn't bearish solely due to the share price drop but is starting to question the quality of earnings and future shareholder returns.
This is the core contradiction currently facing HSBC Holdings. It remains a large banking stock with dividend appeal, but the market is no longer focused solely on dividends; it now demands stable earnings, controllable provisions, and consistent buybacks. If the market finds that while dividends are maintained, earnings pressures and potential risks are increasing, valuations will be compressed first.
Another important sentiment is that many investors are still consoling themselves with the idea of 'holding long-term for dividends.' For true low-cost, long-term holders, this may not be an issue, but for those who bought at higher levels or were betting on short-term performance, the situation is entirely different. If the cost basis is above 140, one cannot simply use 'long-term dividend collection' to mask short-term risks. Dividend-paying stocks can also undergo valuation adjustments and require technical stop-loss levels and phased strategies.
Technically, the most critical levels for HSBC Holdings now are not 140 or 120, but 134.997 and 134.249. These two levels represent the first line of defense for whether the stock can stabilize. If the price can hold around this zone, combined with a recovery after being oversold, there might be a short-term technical rebound. However, such a rebound should initially be viewed as a correction, not immediately taken as a sign of strength.

The key to truly improving the trend lies at 140.230. HSBC Holdings needs to break back above the middle axis of the Bollinger Bands at 140.230 before the market will start believing this is merely a recovery after a sharp drop, rather than the start of a new downtrend. If it fails to reclaim 140.230, even a rebound of a few points from 136 would just be a weak bounce.
Conversely, if the price breaks below 134.249, sentiment will further deteriorate. Given that HSBC Holdings has already experienced heavy selling today, breaking below the lower Bollinger Band would indicate continued selling pressure, which would intensify market discussions about levels like 130, 128, or even lower. At that point, funds originally intending to bottom-fish might turn cautious, making a rebound even harder to form.
The Relative Strength Index (RSI) stands at approximately 32.760, showing clearly weak momentum, approaching the oversold zone but without confirmation of a rebound. This requires special caution. Being oversold does not equal an immediate bottom; it only indicates a deep decline. A true bottom requires price stabilization, steady trading volume, and the recapture of key levels.
Overall, HSBC Holdings isn't experiencing a sudden loss of value, but rather the market is re-evaluating its performance, provisions, buyback expectations, and earlier accumulated gains. After the share price dropped sharply from its peak, investors are most prone to two mistakes: the bullish side quickly thinking 'HSBC won't fall too much,' while the bearish side prematurely amplifies a single earnings disappointment into a complete collapse. A more reasonable judgment would be to first see if 134.249 can hold, then check if 140.230 can be recovered.
For short-term strategy, HSBC should use 134.997 and 134.249 as defensive zones. If it can hold these levels, there may be a technical rebound in the short term, but before breaking above 140.230, confirmation of the rebound remains insufficient. If it breaks back above 140.230, the trend might improve. If it falls below 134.249, further weakening risks need to be watched.
In conclusion, for HSBC Holdings, it's not just about whether it’s worth collecting dividends now, but first asking whether the selling pressure has ended. High-yield blue chips can also experience sentiment-driven valuation declines. At this stage, the key isn’t rushing to judge that there will definitely be a rebound tomorrow, but observing whether 134.249 can hold and whether 140.230 can be reclaimed.
Key strategy for HSBC Holdings (00005): A technical rebound can be expected if support holds above $134.997 and $134.249; an improvement in trend requires breaking through $140.230; beware of further weakness if it falls below $134.249.
Strategy One | Hold above $134.997 for a rebound opportunity
26077 | $143.88 | 9.1x leverage | Close to current price on the upside, suitable for capturing the early stages of a rebound after confirming support
26524 | $148.88 | 9.8x leverage | Higher flexibility, suitable for capturing acceleration before resistance during an extended rebound
24208 | $131.88 | 7.0x leverage | More conservative structure close to price, reduces volatility in cautious positioning
Strategy Two | Buy above 140.230, target 146.211
22630 | 145.10 | 8.6x leverage | Corresponds to upper resistance zone, suitable for following the trend after a breakout
22483 | 145.00 | 8.6x leverage | Balanced leverage, suitable for medium-short term holding
22817 | 145.10 | 8.2x leverage | Slightly higher flexibility, suitable for aggressive positioning after confirmation of a breakout
Strategy Three | Sell if it falls below 134.249, guarding against weakness
25460 | 126.56 | 10.8x leverage | Close to lower range, suitable for capturing early signs of weakness after support breaks
26362 | 126.76 | 11.3x leverage | Higher leverage, suitable for accelerating positions after confirming a downturn
28117 | 122.78 | 7.7x leverage | Further away, suitable for bearish trend extension
Reminder: This article does not constitute any investment advice.
This article is for reference only and does not constitute any investment advice. The market data, opinions, and analysis contained herein may change at any time without prior notice. We are not responsible for any loss or damage caused by reliance on the information in this article. Technical analysis only shows whether certain technical conditions are met; a comprehensive assessment of asset performance should combine other data and should not solely rely on this article to make trading decisions. Please note that past performance is not indicative of future results. Follow Jenny's insights on Hong Kong stock warrants for more professional analysis.
Risk Disclaimer: The above content only represents the author's view. It does not represent any position or investment advice of Futu. Futu makes no representation or warranty.Read more


Comments
to post a comment
4