
CPU returns to the core of AI! Who are the big winners?

Tencent remains weak; the market's real misjudgment is equating 'good company quality' directly with 'the stock price has bottomed out'.
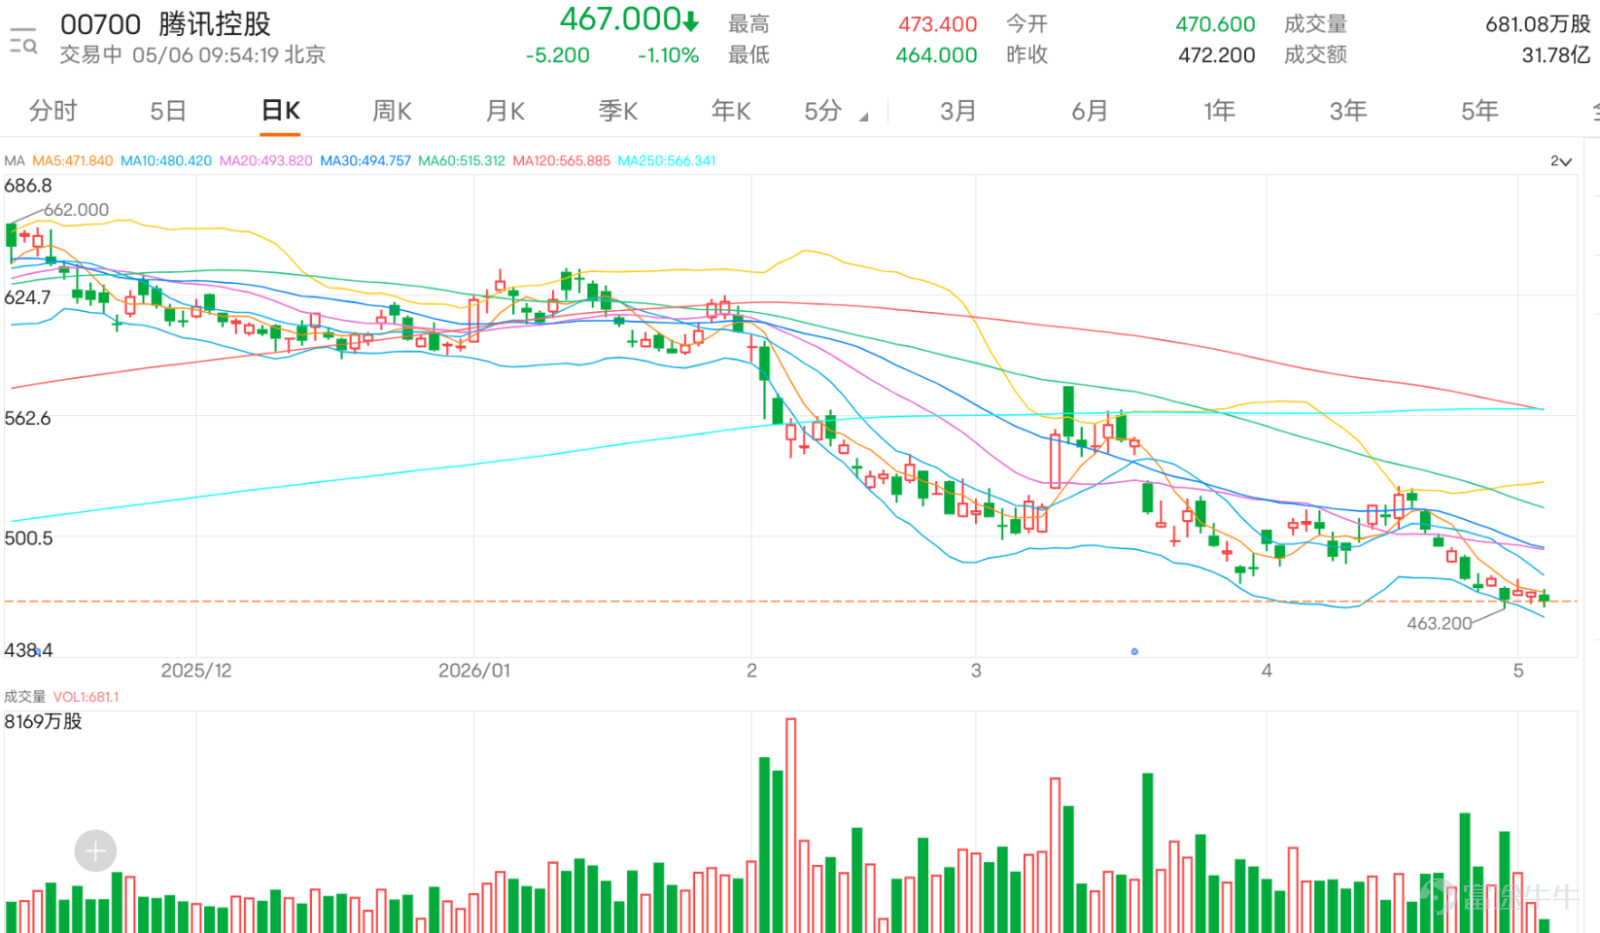
$TENCENT (00700.HK)$ Latest price at 476.000, down 1.13%. Investors' comments are clearly divided: on one side, some believe Tencent is undervalued, optimistic about its performance ahead, and see AI and gaming as catalysts, even predicting targets of 500, 540, or 600. On the other side, some think Tencent has become a stagnant stock that 'falls instead of rising,' with capital flowing into new AI-driven themes, and short-term prices may test lower levels.
The most valuable aspect of these comments is that they reflect the market doesn't misunderstand Tencent's fundamentals, but is beginning to question whether 'a good company still equals a good stock price.' Many investors mention Tencent's profits, buybacks, AI monetization, WeChat ecosystem, and Q1 earnings expectations, while also complaining about the stock's long-term stagnation, lack of upward movement despite southbound capital buying, and its daze amid record highs in US stocks. This gap is the core trading contradiction for Tencent at present.
The market's biggest misjudgment now is prematurely treating performance expectations as confirmation of a bottom. Tencent's current price remains below the 10-day line at 485.620 and the middle axis of the Bollinger Band at 494.930, with the short-term structure yet to recover. In other words, even though the market anticipates strong earnings on May 13, advancements in AI commercialization, and buyback guidance, unless the stock price can first rise back above 485.620, technically it would still be a weak rebound rather than a sign of strengthening.
On the other hand, bears may also underestimate the defensive significance near HKD 462.155. The current price is already close to the lower Bollinger Band at HKD 462.155, with a relative strength index of around 33.204, indicating weak momentum but also proximity to a short-term low area. A large number of extremely bearish comments have appeared, such as targets below 400, 300, 200, or even 178. If this kind of sentiment concentrates and the stock price doesn't break below HKD 462.155 again, it could instead fuel a short-term rebound.
The key lies in the contraction of trading volume. The decline has not seen significant expansion in volume, indicating that it is not a panic-driven sell-off for now; however, the rebound also lacks trading support, suggesting that funds are still unwilling to confirm a return below 485.620. This also explains why the market feels that 'Tencent has everything going for it, except its stock price won’t rise': the fundamental narrative remains intact, but the price hasn’t yet provided confirmation.
The real short-term focus is not on 600 or 400, but on 485.620. If Tencent can rise above 485.620 again, it will meet the initial conditions for a rebound, and then we’ll see if 494.930 can restore the midpoint. If even 485.620 cannot be reclaimed, all earnings expectations can only be regarded as awaiting catalysts and won't change the weak structure.
Conversely, if it falls below 462.155, the market's fear of 'testing new lows' will intensify, further confirming the weakness.
Overall, Tencent isn’t lacking fundamental value, but its technical structure hasn’t aligned yet. The short-term risk-reward ratio is low, and at this stage, one shouldn’t use the phrase 'good company' as a substitute for entry signals. The true trading boundary is: below 485.620 remains weak, and only a breakout above confirms a rebound; losing 462.155 would signal further weakness.
Key strategy: Remains weak unless it climbs back above 485.620; a rebound recovery can be anticipated only if it breaks through 485.620 again. If it falls below 462.155, further weakening should be guarded against.

Strategy One | Defend 462.155 for a weak rebound
$UBTENCT@EC2608A.C (15505.HK)$ | Strike price 610.00 | 9.3x leverage | Strike price still within a 30% range, suitable for betting on a short-term recovery after defending the lower boundary. $BPTENCT@EC2609A.C (14792.HK)$ | Strike price 609.50 | 10.8x leverage | Higher flexibility, suitable for more aggressive follow-up when rebound momentum improves. $BITENCT@EC2608A.C (15532.HK)$ | Strike price 610.00 | 9.1x leverage | Slightly lower leverage, suitable for betting on a rebound without being overly aggressive.
Strategy Two | Chase rebound after breaking through 485.620
$UBTENCT@EC2609D.C (27928.HK)$ | Strike price 600.40 | 9.5x leverage | Suitable for chasing rebounds after breaking through the 10-day line, higher flexibility$CTTENCT@EC2609A.C (27913.HK)$ | Strike price 600.40 | 10.1x leverage | Higher leverage, suitable for quick in-and-out after breakout confirmation$HSTENCT@EC2609F.C (28217.HK)$ | Strike price 600.40 | 9.3x leverage | Balanced elasticity and risk, suitable for targeting a rise towards 494.930
Strategy Three | Bet on weakening if it falls below 462.155
$UBTENCT@EP2609A.P (28461.HK)$ | Strike price 449.80 | 6.4x leverage | Close to lower support breach area, suitable for capturing pullback elasticity after falling through$UBTENCT@EP2608C.P (26703.HK)$ | Strike price 437.80 | 8.1x leverage | Higher leverage, suitable for aggressive positioning after weakness confirmation$UBTENCT@EP2608B.P (26702.HK)$ | Strike price 428.68 | 8.5x leverage | Lower strike price, suitable for capturing larger volatility when the downtrend extends
Feel free to share your insights in the comment section. For more market analysis, please continue following ‘Hong Kong Stock Warrants Jenny’ for daily updates!
Reminder: This article does not constitute any investment advice.
This article is for reference only and does not constitute any investment advice. Market data, opinions, and analysis contained herein may change at any time without prior notice. We are not responsible for any loss or damage caused by reliance on the information in this article. Technical analysis only shows whether certain technical conditions are met; asset performance should be comprehensively evaluated using other sources of information, and trading decisions should not be made solely based on this article. Please note that past performance is not indicative of future results.
#HKStocks #RealTimeAnalysis #WarrantPick #WarrantGuide #DerivativesHedging #HKWarrantsJenny #HangSengIndex #Tencent #BlueChipStocks #TechnicalAnalysis$Hang Seng TECH Index (800700.HK)$$Hang Seng Index (800000.HK)$
Risk Disclaimer: The above content only represents the author's view. It does not represent any position or investment advice of Futu. Futu makes no representation or warranty.Read more

Comment (1)
to post a comment
2