
CPU returns to the core of AI! Who are the big winners?

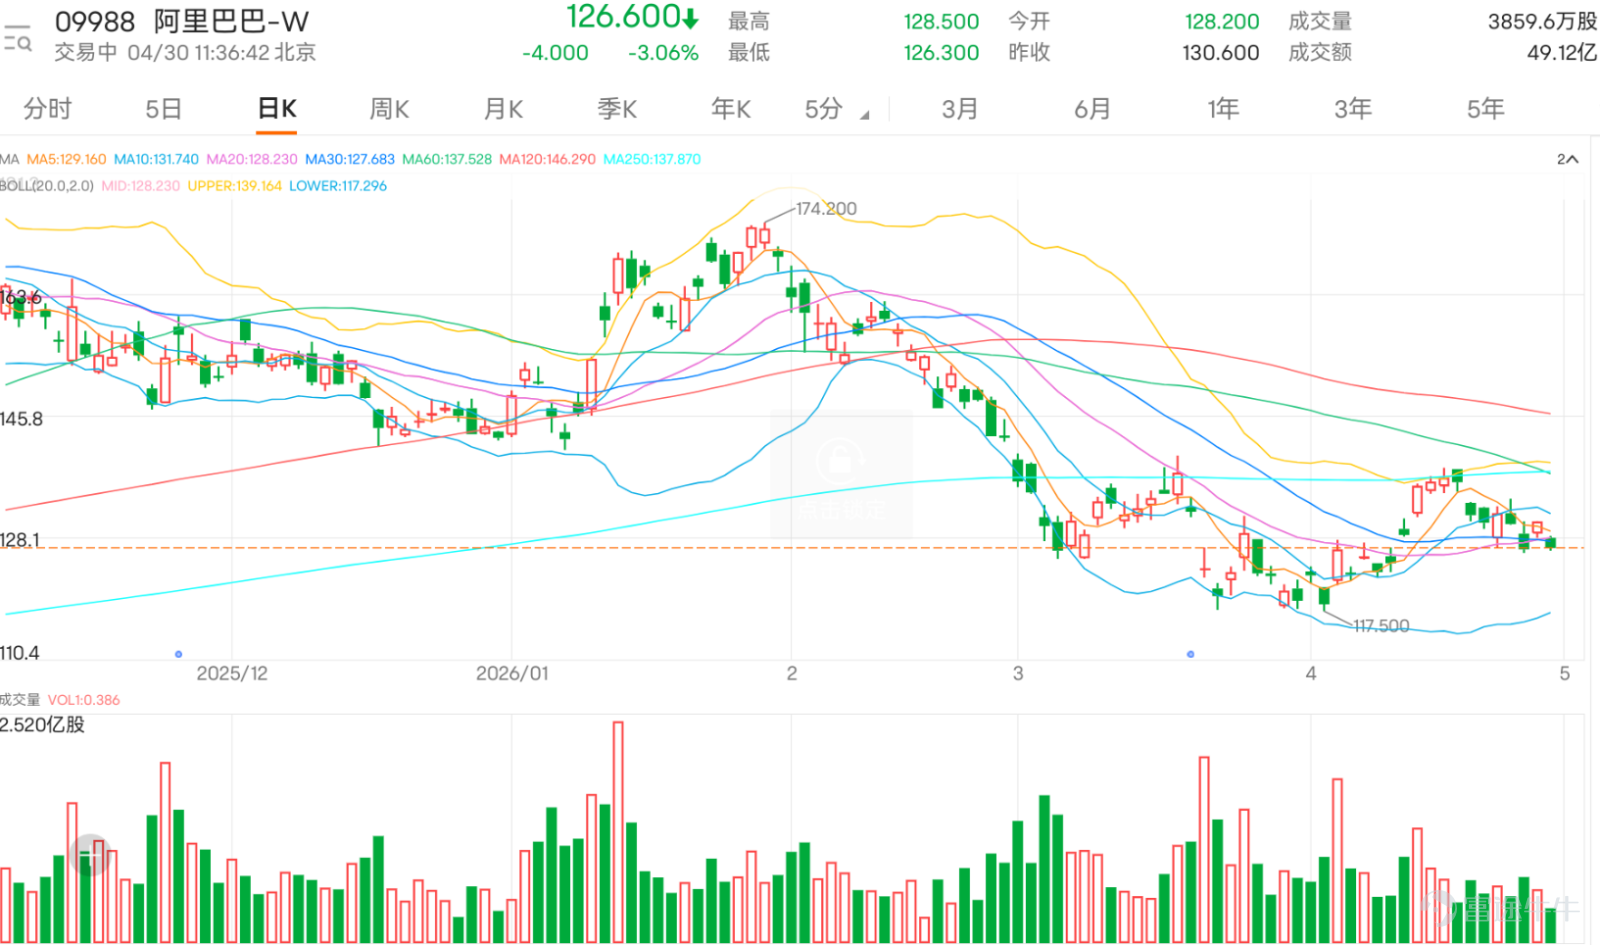
For Alibaba, 127.920 is the short-term watershed, and 132.650 is the key to a short-term breakout.
$BABA-W (09988.HK)$ The current price is 126.6 yuan, down 3.06%, already breaking below the 5-day, 10-day, and 20-day moving averages, interrupting the short-term rebound trend.
Comments focus on whether it can break through near 130 yuan, insufficient trading volume, whether resistance above remains, and whether the mid-term can slowly strengthen. Many investors still see potential for Alibaba’s gradual upward movement or catch-up rally, with targets mentioned at 138, 150, or even higher; however, some investors believe the pressure at 130 yuan is obvious, with prolonged stagnation, insufficient liquidity, and even worry that the current price might be the last chance to exit.
Market sentiment leans towards cautious observation but with slight anticipation. The bullish side mainly bets on the weekly chart strengthening, valuation recovery, and capital inflow, believing that breaking through the 130 to 132 range could trigger a larger rebound. On the bearish side, concerns center around low trading volume, sluggish business growth, and heavy resistance above.
Common questions focus on three points: First, whether the price has broken through 130; second, how high the upward movement can go; third, if it continues to consolidate, does that mean the rebound has failed? Technically, 127.920 is the short-term watershed. As long as this level holds, the trend still has room for gradual improvement. However, to confirm strength, a re-break above 132.650 is necessary. If it successfully breaks out, there’s potential to test 139.350 in the short term. Conversely, if it falls below 127.920, one must be mindful of the risk of testing 116.490.
At this stage, the reward-risk ratio is neutral. A more prudent strategy is to hold above 127.920 and look for consolidation. Only a break above 132.650 would confirm renewed strength; before that happens, it's not advisable to prematurely assume a one-way uptrend has begun.
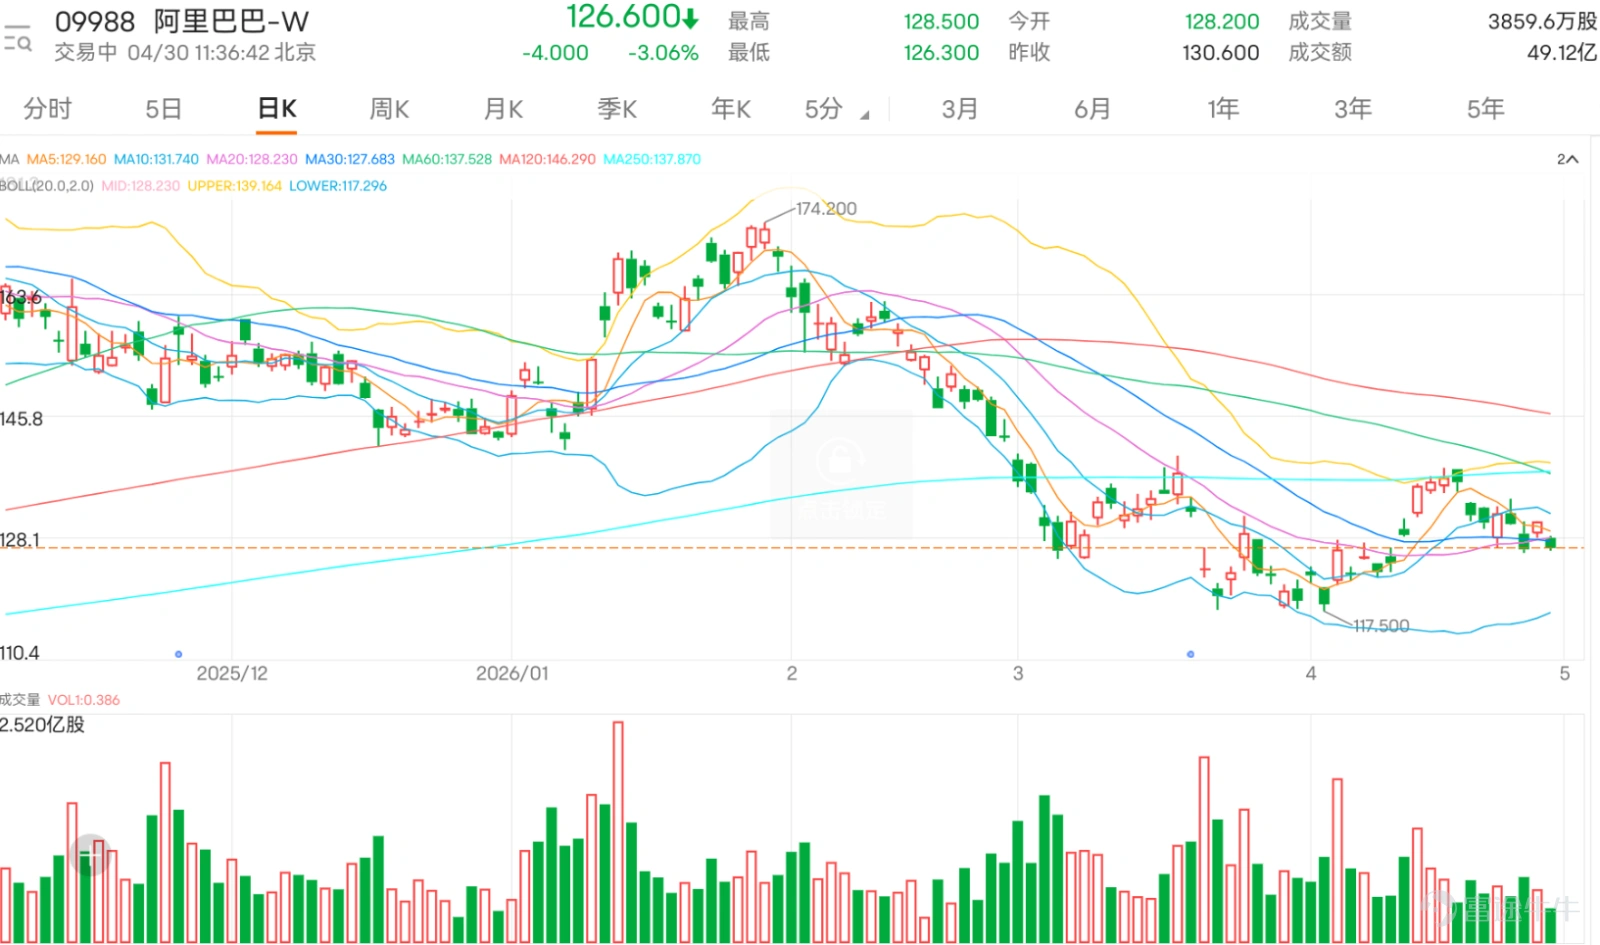
Key deployment: Hold firmly above 127.920 and break through 132.650, then look for 139.350 in the short term. If it falls below 127.920, watch for downside risks toward 116.490.
Strategy One | Rebound Deployment After Holding 127.920
$UBALIBA@EC2607E.C (26541.HK)$ | Strike Price 137.09 | Actual Leverage 8.5x | Close to current price on the upside, suitable for capturing early rebounds after holding support. $CIALIBA@EC2607A.C (26695.HK)$ | Strike Price 137.08 | Actual Leverage 8.7x | Higher leverage, suitable for amplifying returns when the rebound accelerates. $BIALIBA@EC2610B.C (28064.HK)$ | Strike Price 135.00 | Actual Leverage 4.8x | More stable leverage, suitable for phased deployments in volatile markets.
Strategy Two | Chasing the Rebound After Breaking Through 132.650
$UBALIBA@EC2608F.C (26538.HK)$ | Strike Price 150.09 | Actual Leverage 7.0x | Mid-out-of-the-money position, suitable for capturing extended upside after a breakout. $HSALIBA@EC2608F.C (26604.HK)$ | Strike Price 150.09 | Actual Leverage 7.1x | Balanced choice, suitable for following up after confirming the breakout. $CTALIBA@EC2608D.C (26326.HK)$ | Strike price 168.98 | Actual leverage 9.0x | Higher leverage, suitable for aggressive deployment after breakout
Strategy three | Deployment if it breaks below 127.920
$UBALIBA@EP2607A.P (20367.HK)$ | Strike price 130.00 | Actual leverage 6.1x | Close to support level, suitable for capturing initial weakness after breaking down
$UBALIBA@EP2607C.P (26011.HK)$ | Strike price 127.28 | Actual leverage 5.4x | Close to lower range, suitable for observing retracement towards 116 $UBALIBA@EP2607B.P (24646.HK)$ | Strike price 122.78 | Actual leverage 5.9x | Higher leverage, suitable for aggressive deployment during accelerating weakness
Reply to some investors' views:
@看趋势 A bullish turn on the weekly chart would benefit mid-term sentiment, but a short-term breakthrough above 132.650 is still needed
@gardenlau0 If 126 appears, it indicates a breakdown below 127.920, and the short-term trend will weaken
@232452596 179 is a farther target; focus on 139.350 in the short term
@慢慢來 152 requires breaking through 139.350 first before gradually aiming higher
@kram555hk Until 127.920 is officially broken, the final escape opportunity has not yet passed
Reminder: This article does not constitute any investment advice.
This article is for reference only and does not constitute any investment advice. The market data, opinions, and analysis contained herein may change at any time without prior notice. We are not responsible for any loss or damage caused by reliance on the information in this article. Technical analysis only shows whether certain technical conditions are met; a comprehensive assessment of asset performance should be conducted using additional data. Decisions to trade should not be based solely on this article. Please note that past performance is not indicative of future results.
#HKStocks #Real-TimeAnalysis #WarrantPick #WarrantGuide #DerivativesHedging #HKWarrantsJenny #Alibaba #09988 #Blue-ChipStocks #TechnicalAnalysis$Hang Seng Index (800000.HK)$$Hang Seng TECH Index (800700.HK)$
Risk Disclaimer: The above content only represents the author's view. It does not represent any position or investment advice of Futu. Futu makes no representation or warranty.Read more

Comment (1)
to post a comment
1
1