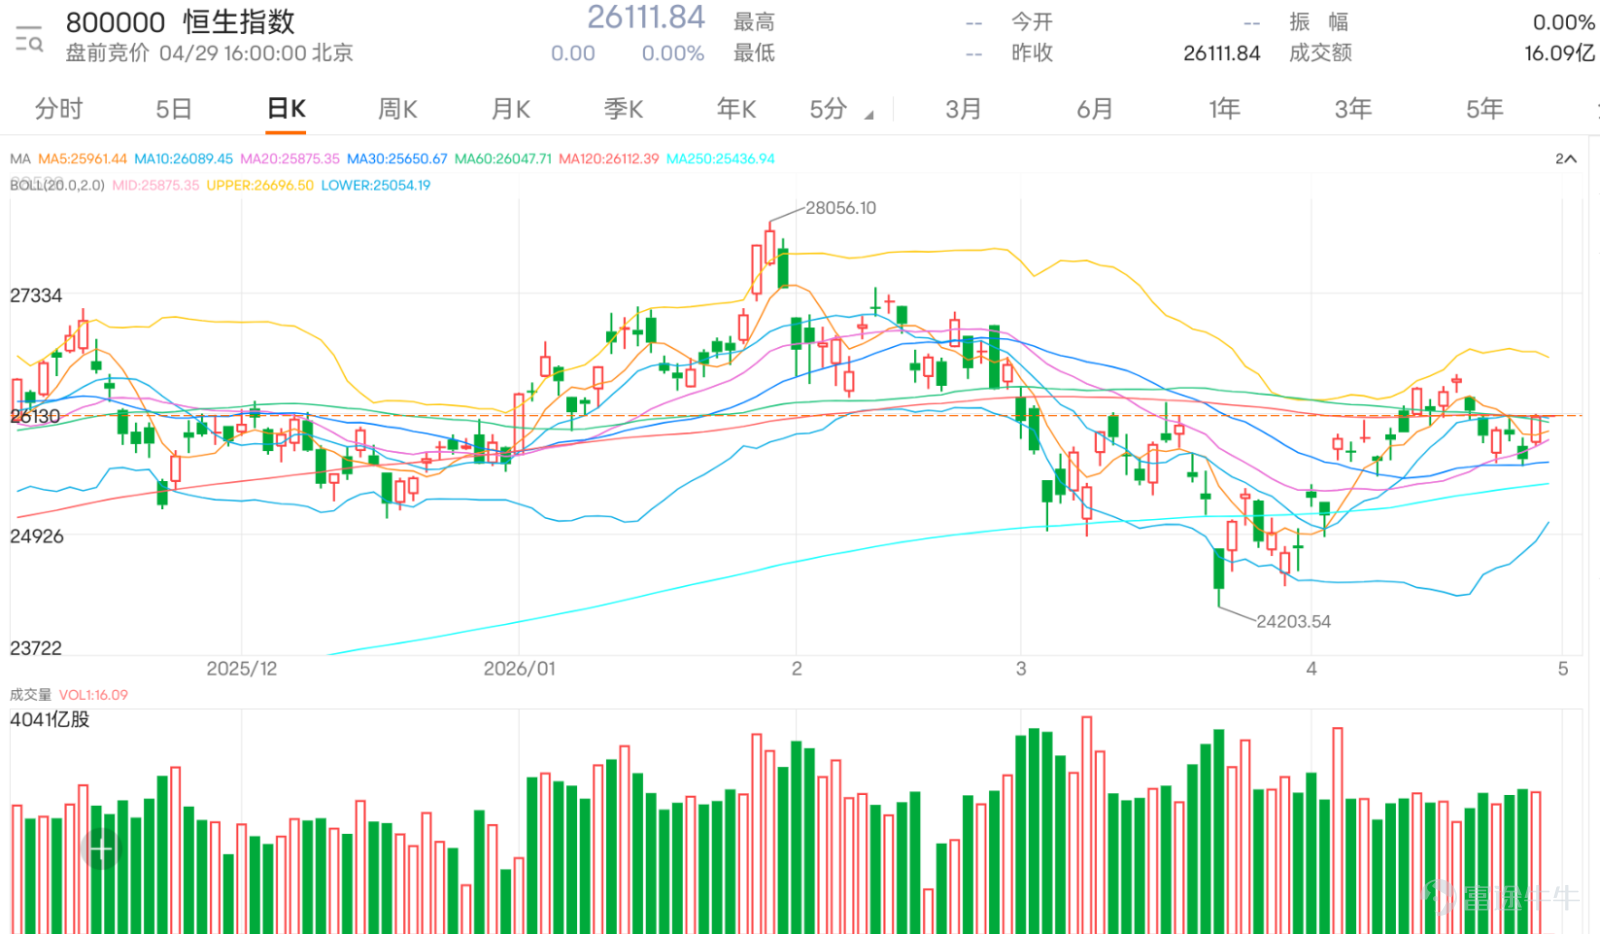

The Hang Seng Index has returned above the 26,000 level; is it a breakout or weakening at the highs?
$Hang Seng Index (800000.HK)$ Last session closed at 26,106.98, hovering near the 10-day line at 26,117.21 without an effective upside breakout, while still holding above 25,807.05, indicating overall consolidation at high levels. Technically, 25,807.05 is the short-term watershed; as long as this level holds, the structure hasn’t weakened. However, failing to break through 26,117.21 suggests insufficient upward momentum. If the market can stabilize and break above 26,117.21, there will be potential for testing 26,754.11; otherwise, range-bound fluctuations will dominate.
Market chatter reflects significant divergence: some investors believe that the 26,000 mark offers strong support and even anticipate a late-session rally; others are more cautious, believing the peak has been reached or foreseeing a short-term pullback to 25,900 or lower. Many comments focus on questions such as “the direction after 3 PM,” “will it plummet?” and “are we seeing profit-taking at highs?” This indicates heavy观望气氛 (observation sentiment) at high levels with no consensus direction formed.
Overall market sentiment remains indecisive and cautiously biased. Although the index hasn't shown clear signs of weakness, it also failed to break through key resistance, reflecting a lack of aggressive buying interest. The short-term focus remains within the 25,807.05–26,117.21 range, a typical pending range.
Strategically, if the market can hold steady above 25,807.05 and break through 26,117.21, it could signal a short-term strengthening, with potential to test 26,754.11. Conversely, if it fails to hold 25,807.05, one must guard against a retest of 25,420.11, at which point high-level consolidation could evolve into a correction.April 29 [HK Stocks Podcast] Part 1 - Hang Seng Index, Meituan, China Mobile

Key Deployment: Maintain a rebound setup above 25807.05; if it breaks above 26117.21, aim for 26754.11; if it falls below 25807.05, watch out for a retest risk at 25420.11.
Strategy One | Rebound Deployment After Holding Above 25807.05
$UB#HSI RC2812E.C (62623.HK)$ | Recovery Price 25508 | Actual Leverage 43.5x | Close to support level, suitable for rebounding after holding above 25807, high flexibility but strict stop-loss required
$UB#HSI RC28113.C (56120.HK)$ | Recovery Price 25500 | Actual Leverage 43.5x | Recovery price close to the support zone at 25420, suitable for short-term confirmation of non-break and then chasing a rebound
$BP#HSI RC28129.C (55784.HK)$ | Recovery Price 25500 | Actual Leverage 45.0x | Higher leverage, suitable for aggressive capital chasing intraday rebound, not recommended to hold for long
Strategy Two | Momentum Deployment After Breaking Through 26117.21
$UB#HSI RC2810E.C (56201.HK)$ | Recovery Price 25500 | Actual Leverage 42.8x | More suitable for chasing momentum after breaking through the 10-day line, sufficient flexibility, while maintaining a reasonable distance from current price
$CT#HSI RC2809O.C (55925.HK)$ | Recovery Price 25500 | Actual Leverage 42.8x | Suitable for expecting continuation of upward momentum after the breakout, leans toward short-term trading
$GJ#HSI RC2810M.C (55791.HK)$ | Recovery Price 25500 | Actual Leverage 42.8x | High street leverage, suitable for active trading during high-volume periods in combination with a breakout strategy, but be mindful of volatility in high-street products
Strategy Three | Pullback Deployment After Approaching Resistance at 26754.11
$UB#HSI RP28111.P (66474.HK)$ | Recovery price 26,750 | Actual leverage 31.8 times | Close to upper resistance zone, suitable for short-term pullback deployment when the index rises near 26,754 but fails to break through
$UB#HSI RP2803D.P (69174.HK)$ | Recovery price 26,700 | Actual leverage 33.9 times | Closer recovery price, higher flexibility, suitable for use when bearish signals at highs are more evident
$UB#HSI RP2804H.P (67143.HK)$ | Recovery price 26,650 | Actual leverage 36.8 times | Higher leverage, suitable for capturing quick pullbacks before resistance levels, but with higher risk
Reply to some investors' views:
@231764282If bearish, it is necessary to first confirm a breakdown below 25,807; otherwise, bear certificates could easily be shaken out
@321john The risk of being bearish at highs lies in the lack of breaking support; whether it breaks below 25,807 needs attention to have better confidence
@231619491No clear one-sided trend in the short term; judging direction too early carries higher risk
@有贏就得 A plunge requires a breakdown below support; otherwise, it's likely just a shakeout
@長澤姐姐 Sharp declines typically occur after key levels are breached; at this stage, it has not yet happened
Reminder: This article does not constitute any investment advice.
This article is for reference only and does not constitute any investment advice. The market data, opinions, and analysis contained herein may change at any time without prior notice. We are not responsible for any loss or damage caused by reliance on the information in this article. Technical analysis only shows whether certain technical conditions are met; a comprehensive assessment of asset performance should be conducted using additional data. Decisions to trade should not be based solely on this article. Please note that past performance is not indicative of future results.
#HKStocks #RealTimeAnalysis #WarrantPick #WarrantGuide #DerivativesHedging #HKWarrantsJenny #HangSengIndex #HangSengTechIndex #BlueChipStocks #TechnicalAnalysis$Hang Seng TECH Index (800700.HK)$$Hang Seng China Enterprises Index (800100.HK)$
Risk Disclaimer: The above content only represents the author's view. It does not represent any position or investment advice of Futu. Futu makes no representation or warranty.Read more

Comments
to post a comment
1