Baidu's AI market expectations are constrained by the technical "sell" signal, with short-term rebound focusing on the battle around 125.9 yuan
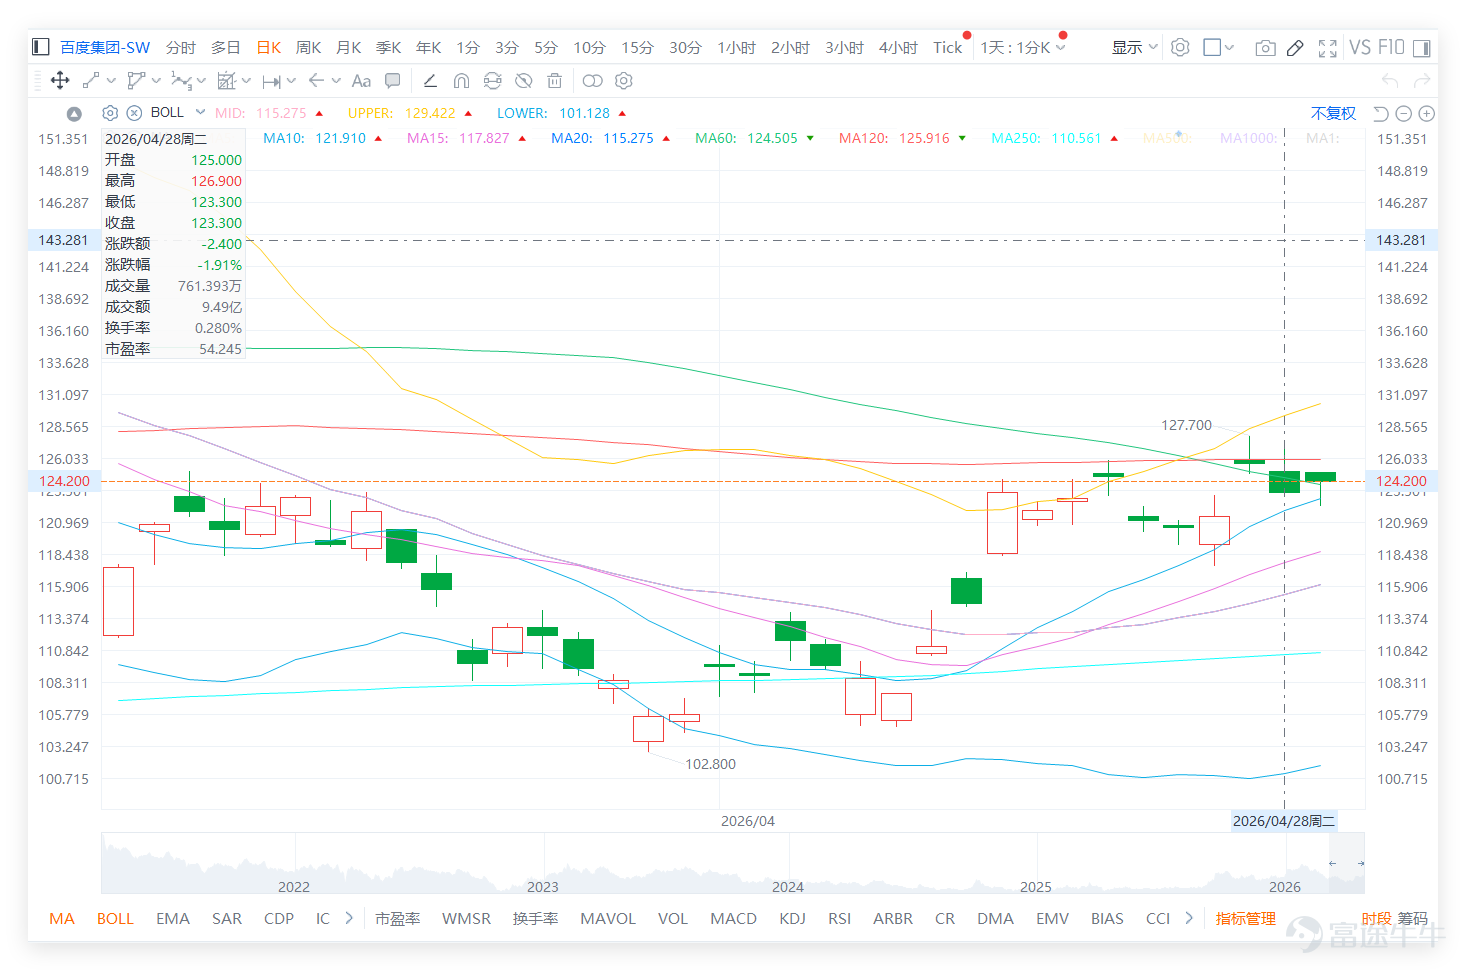
The closing price on the previous day (August 28) was 123.30 yuan, representing a single-day decline of 1.91%. The 'Summary Signal of Technical Indicators' indicated a "sell". Relevant moving average data shows MA10 at 121.91 yuan, MA30 at 115.63 yuan, and MA60 at 124.51 yuan.

Looking at the technology and internet peers, the market performance on the previous day (August 28) was mixed, with Baidu falling by 1.91%, while $BABA-W (09988.HK)$ 、 $TENCENT (00700.HK)$ 、 $MEITUAN-W (03690.HK)$ 、 $NTES-S (09999.HK)$ 、 $JD-SW (09618.HK)$ 、 $XIAOMI-W (01810.HK)$ the technical signals for others generally pointed to "buy".
Notably, among these major peers, Baidu is the only stock with a clear "sell" indication in its summary technical indicators. This suggests that Baidu’s weak rebound occurs in an environment where the overall sector’s technical outlook turns positive, but its own system rating remains bearish. The divergence between its “sell” signal and the general “buy” signals from peers highlights the market's relatively cautious stance toward its short-term trend. This also implies that Baidu's anticipated AI-driven rally will need not only strong catalysts from its fundamentals but may also require further improvement in the overall sector sentiment to drive it.

The sentiment in Baidu's commentary leans toward cautious optimism, with focus centered on AI direction, whether the price can break through 130 yuan, and if there is potential for a medium-term return to the range of 138 to 160 yuan. The overall number of comments isn't high, but it shows that the market is still willing to use the AI concept to imagine the valuation recovery space for Baidu.
Market sentiment isn't overtly pessimistic; instead, most are 'waiting for a breakout' or 'anticipating a major rally.' Some investors question whether Baidu is heading in the wrong AI direction, while others hope for a repeat of past big gains, reflecting that expectations around the AI theme remain alive, though short-term buying consensus is still unclear.
Technically, Baidu's closing price yesterday was 123.300, higher than its 5-day moving average at 122.400, 10-day moving average at 121.910, and 20-day moving average at 115.275, showing improved short-term rebound momentum. However, the previous day’s close at 123.300 remains below the 60-day moving average at 124.505 and the 120-day moving average at 125.916, making 124.505 to 125.916 the key resistance zone. The Relative Strength Index (RSI) stands at 61.142, indicating some improvement in momentum, but until the price breaks above 125.916, the rebound hasn’t fully strengthened.
For short-term positioning, if Baidu can break through 124.505 and 125.916, there may be an opportunity to further test 129.422, at which point the area around 130 yuan would become the next psychological threshold. Conversely, if it fails to hold above 122.400, one should beware of weakening rebound momentum and the risk of testing 115.275. At this stage, the risk-reward ratio is neutral, making it more suitable to wait for confirmation of a breakout.
Reply to some investors' views:
@角大师 Racing down the wrong AI path! AI is the next big trend, but it might be heading in the wrong direction.
AI remains the core theme for Baidu's valuation recovery, but the stock price must first break through 125.916 before the market will more confidently confirm the direction.
@潮汕首富 I'll wait for you at 138
To target 138 yuan, it must first break through 125.916 and then surpass 129.422, requiring step-by-step confirmation in the short term.
@Kin HungShek1 Is 130 okay?
Reaching 130 yuan is possible, but only if it first breaks through the resistance zone between 124.505 and 125.916.
Based on the above analysis, the strategies for deployment can be divided into the following main approaches:
Key deployment: If Baidu holds above 122.400, conditions for a rebound remain intact. Breaking above 124.505 to 125.916 confirms strengthening momentum; however, if it falls below 122.400, caution against a pullback testing 115.275 is warranted.
Strategy One | Hold 122.400 to play for a rebound
$HSBAIDU@EC2607A.C (20356.HK)$ | Strike Price 132.88 | Actual Leverage 7.5x | Quick response after nearing upper resistance, suitable for short-term rebound plays once support holds
$UBBAIDU@EC2609A.C (28166.HK)$ | Strike Price 140.00 | Actual Leverage 5.0x | Moderately out-of-the-money, suitable for early rebound plays without being too close to the current price
$MSBAIDU@EC2609A.C (27488.HK)$ | Strike Price 139.90 | Actual Leverage 5.0x | A more balanced choice, suitable for following rebounds after stock price stabilizes
Strategy Two | Break above 125.916 to chase momentum
$UBBAIDU@EC2607B.C (25832.HK)$ | Strike Price 160.09 | Actual Leverage 7.7x | Higher flexibility, suitable for chasing short-term extensions after breaking through resistance
$HSBAIDU@EC2607E.C (25866.HK)$ | Strike Price 160.09 | Actual Leverage 7.8x | High-leverage momentum tool, suitable for quick in-and-out trading after breaking through resistance
$MSBAIDU@EC2607A.C (25117.HK)$ | Strike Price 159.99 | Actual Leverage 7.5x | Suitable for following up after breakout confirmation; not advisable to chase aggressively before a breakout
Strategy Three | Drop below 122.400 to anticipate pullback
$UBBAIDU@EP2607A.P (20739.HK)$ | Strike Price 113.78 | Actual Leverage 5.5x | Close to lower support zone, suitable for capturing pullbacks after breaching key levels
$HSBAIDU@EP2607A.P (20774.HK)$ | Strike Price 113.78 | Actual Leverage 5.6x | Slightly higher flexibility, suitable for short-term bearish outlook after dropping below 122.400
$CIBAIDU@EP2607A.P (20548.HK)$ | Strike price 113.88 | Actual leverage 5.4 times | A more balanced choice, suitable for those expecting a retest of 115.275 but not wanting to be too aggressive
For more market analysis, stay tuned to Jenny's daily updates on 'Hong Kong Stock Warrants'!
Reminder: This article does not constitute any investment advice.
This article is for reference only and does not constitute any investment advice. The market data, opinions, and analysis contained herein may change at any time without prior notice. We are not responsible for any loss or damage caused by reliance on the information in this article. Technical analysis only shows whether certain technical conditions are met; a comprehensive assessment of asset performance should be conducted using additional data. Decisions to trade should not be based solely on this article. Please note that past performance is not indicative of future results.
#HKStocks #Baidu #Real-TimeAnalysis #WarrantSelection #WarrantGuide #DerivativesHedging #HKWarrantsJenny #Blue-ChipStocks #TechnicalAnalysis
Risk Disclaimer: The above content only represents the author's view. It does not represent any position or investment advice of Futu. Futu makes no representation or warranty.Read more

Comments
to post a comment
1